Apple $400: A look at Apple's fundamentals, Part II
 Andy M. Zaky, Bullish Cross, Special to AppleInsider
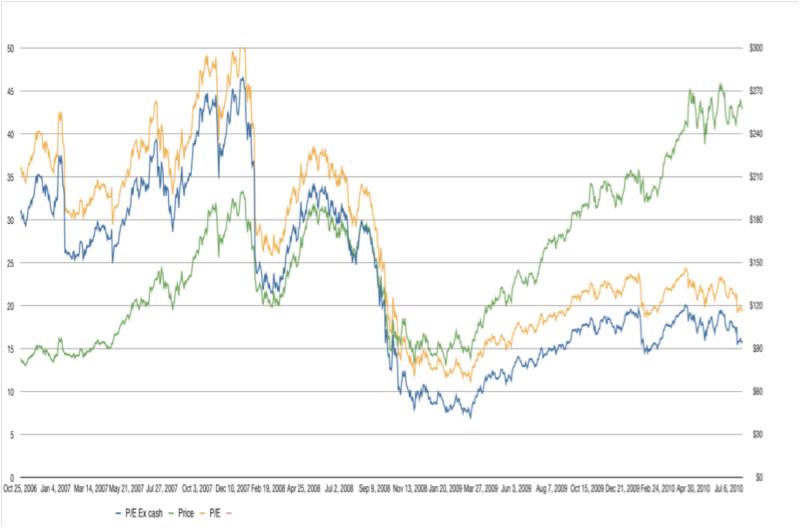
That the day-to-day fluctuations in Apple’s stock price are more determined by the larger concerns of the broader market than they are with the company’s strong fundamentals. So keeping these concerns in mind, what investors want to know is: what is Apple worth and is the company currently undervalued? The short answer - Apple is definitely undervalued, and it should be trading at around $400 come 2012.
Traditional Valuation Metrics: Trailing & Forward P/E Ratios
The very first thing investors learn about fundamental analysis is that stocks are generally valued on a price-to-earnings ratio, and that a stock’s growth rate is what determines the multiple it receives in the analysis. For example, on a traditional trailing 12-month P/E valuation analysis where one multiplies Apple’s $15 in EPS by its 70% growth rate, Apple ‘should be’ worth about $1,050 a share on a trailing basis come this October.
Yet, as anyone who takes valuation seriously knows, stocks are seldom valued on their trailing P/E ratio. Instead, the market tends to value stocks based on their future expected earnings and long-term expected growth rate. In other words, key to the equation is what will Apple earn over the next 12-months, and what is expected out of the company in terms of growth over the next 5 years. Cash also plays a very important role in the analysis, but not in the way one would expect. We’ll get to cash in a moment.
So setting aside the issue of Apple’s enormous cash position, Wall Street analysts are generally modeling for Apple to earn $14.43 in EPS for fiscal 2010 and approximately $17.47 for fiscal 2011 – that’s about 21% earnings growth. Moreover, when looking at what is expected out of the company over the next 5-years, analysts are modeling for about 18% earnings growth. Thus, based on these conservative variables, Apple should be currently trading at about 18 times next year’s earnings of $17.47 in EPS or about $314.46 a share. That’s about $54.46 above Friday’s close.
Looking at the future trailing P/E to beat Wall Street
Yet, simply analyzing Apple’s (AAPL) forward P/E ratio doesn’t really tell anyone what the company ought to be worth in the future. It only tells us whether the stock is currently undervalued, and what it ought to be trading at today. To get an idea of what the company will be trading at in the future, it is vital to ascertain not only what type of trailing P/E the market is likely to give Apple in late 2011 or early 2012, but what the company will actually report in earnings. This is precisely where investors can beat Wall Street at their own game, and sums up the value offered by independent analysts who consistently outperform Wall Street in forecasting Apple’s earnings.
If there is one thing that readers should take away from this article it’s that you should never fight Wall Street’s valuation metrics. Instead of relying on some alternative way to valuate the company to determine future price targets, embrace the market’s valuation but beat it on the earnings front. For while the market might continue to give Apple an 18 to 20 trailing p/e ratio well into the future despite Apple’s enormous cash holdings and robust 50-70% growth rate, the one thing that is not determined by the market is the earnings variable of the P/E ratio.
For example, let’s suppose that Apple continues to trade at a 19 to 20 trailing P/E come October 2011. Right now Wall Street analysts are modeling for Apple to earn roughly $17.50 in EPS. At that earnings level, Apple would be trading between $332 and $350 assuming a 19 or 20 multiple. Yet, nearly every independent analyst knows Apple will probably earn about $20 in EPS in 2011.
This is where investors can beat the street in forecasting a more realistic and achievable price target. Based on $20 in EPS for fiscal 2011, Apple should be trading between $380 and $400 in late 2011 early 2012 assuming a 20 multiple. This price-target beats the street by nearly $70 in share value, is based exclusively on the market’s current valuation of the stock, and presents a conservative, simple, and straight-forward analysis of Apple’s valuation.
Basing Price Targets on Wall Street Valuation Metrics not on P/E(x-cash)
Yet, if I ended the analysis right here, I would get no less than 40 messages in my inbox by disgruntled investors explaining to me that it’s irresponsible to valuate Apple on a retroactive trailing P/E basis without backing out Apple’s cash from the analysis.
For example, my 2011 model calls for Apple to generate roughly $18 billion in cash in addition to the $45.8 billion already stockpiled in the company’s coffers. That is a total $63.8 billion or 39.3% growth in cash over the coming year. If one were to back out this cash from Apple’s expected (2011) market capitalization of $376.4 billion, Apple would be trading at a trailing P/E(x-cash) of only 16.6.
Some would even go so far as to argue that Apple should be assigned a 25 P/E(x-cash) in order to conform with a more realistic 5-year growth rate; and that based on an expected $20 in earnings, it should thus be trading at $600 a share on a 30 multiple.
Yet, it’s very unrealistic to assume that the market will suddenly wise up to Apple’s (AAPL) enormous cash position and higher growth rate, and give it a 30 trailing p/e when Wall Street expects Apple to report a mere 18% earnings growth over the next 5 years. For while some might argue that its unreasonable to suggest that Apple will grow at such a meager pace, the market is not so easily convinced. Even if Apple demonstrates that it will far exceed the 18% growth expected over the next 5-years, it will do very little to alter the market’s foregone conclusion to the contrary.
There seems to be this underlying notion with investors that there will be some glorious day deep in the future when Wall Street eventually gives Apple a valuation that is perfect in every regard, and which contemplates the full potential and thrust of Apple’s business model. Theoretically, Apple should have traded at a 50 P/E over the past 5 years, but has only seen that valuation level for only a few moments.
Research in Motion (RIMM) is a fundamental powerhouse growing at astonishing rates, but the market continues to hold the belief that iPhone and Android are going to destroy the Blackberry despite repetitive evidence to the contrary. Research in motion has repeatedly demonstrated its ability to keep up with the competition in the smart phone industry, but the market refuses to give the stock a P/E ratio higher than 10. Altering the market’s perception is no easy task.
Furthermore, the historical record indicates that Apple will likely see an 18 to 22 P/E well into the future. Horace Dediu, a rising star among the independent analyst community, recently published a chart comparing Apple’s stock price, trailing P/E ratio and trailing P/E ratio (x-cash), which I find to be essential in determining the long-term direction and valuation of stock.
From a brief analysis of this chart, one should notice that while Apple has fully recovered and even made fresh all-times highs from the lows of the financial crisis, its P/E ratio has barely even moved. In fact, it has remained relatively flat over the past year and a half indicating apprehension on the part of Wall Street to give Apple a multiple significantly greater than that enjoyed by other similarly situated mega-cap stocks.
Source: Asymco
The Market Capitalization & Return on Equity Problem
Instead of giving Apple the fairest possible valuation to determine the stock price, market participants are relying on Apple’s earnings to drive the stock higher. It is clear that the earnings part of Apple’s P/E ratio has been the determinative factor in the rise of Apple’s stock price over the past 18 months and not a fair valuation. While Apple will probably continue to grow in the 25% to 30% range over the next 5 years, the market is unlikely to give it a P/E any higher than 23 at the high end or 15 at the low end for any extended period of time.
Eventually, all large-cap stocks undergo an age of P/E compression in anticipation of the law of large numbers and lower long-term anticipated growth rates. Even large cap tech companies that continue to significantly outpace the growth of their valuation nevertheless experience major P/E compression. This acts as a ceiling to overall market capitalization and mitigates the problem of return on equity.
When discussing this issue with analysts, I hear the same repetitive concern about Apple’s market capitalization. That despite Apple’s growth rate, business potential, and staggering piles of cash, the fact that its market capitalization is about to surpass Exxon Mobil (XOM) to make Apple the largest company in the United States raises questions about its expected return on equity (eROE). And this is precisely where the issue of cash, expected cash flow and trailing P/E(x-cash) becomes front and center in the equation.
Whenever one debates whether Apple (AAPL) should have a larger market capitalization than Exxon Mobil (XOM), Wal-Mart (WMT), Microsoft (MSFT), Hewlett Packard (HPQ), Google (GOOG), or IBM (IBM), the central issue in the discussion is which of these companies have the highest expected return on equity. That is, for every dollar spent to purchase one of these institutions, which of them would yield the highest return per dollar spent? If someone were to purchase Apple at $375 billion outright, would he or she get a bigger return on that $375 billion or would he or she get a greater return by spending $315 billion to acquire Exxon Mobil? If one produces a higher return with Apple, then Apple is relatively more undervalued than Exxon and vice-versa.
This is precisely why there’s an artificial ceiling on market capitalization. For if Apple were to reach levels clearly suggesting a higher return on equity for Exxon Mobil (XOM) or any other similarly situated mega-cap name, it literally means that Apple is over valued relative to that name. At $400 a share, Apple would have a market capitalization of $376.4 compared to Exxon Mobil’s $315 billion cap, Wal-Mart’s $192.1 billion or Microsoft’s $221 billion market cap.
Yet, having a higher market cap in and of itself isn’t a problem so long as the analysis demonstrates that Apple will likely post a higher return on equity on its market capitalization. Moreover, cash and cash flow must be subtracted from market cap because hypothetical purchasers of the company would get that cash in the acquisition. Thus, net market capitalization becomes the basis for comparison.
This is exactly what investors who think Apple should have a 30 P/E on an expected $20 in earnings fail to realize. At $600 a share, Apple would have a market capitalization of $565 billion or more than Microsoft and Exxon Mobil put together. It is outrageously doubtful to suggest that Apple will somehow demonstrate a higher return on equity than Microsoft (MSFT) and Exxon Mobil (XOM) put together. I hope this demonstrates why it’s almost silly to believe that the market will give Apple a P/E ratio much higher than what it currently trades at in late 2011. Instead, Apple’s future stock price will largely be determined by its growth in earnings as it continues to undergo further P/E compression well into the future. I’ll be exploring the issue of comparative return on equity and comparative market capitalization in future articles to ascertain Apple’s true value. Stay tuned.
Andy Zaky is a graduate from the UCLA School of Law, an AppleInsider contributor and the founder and author of Bullish Cross — an online publication that provides in-depth analysis of Apple's financial health.


 Marko Zivkovic
 Amber Neely
 Christine McKee
 Malcolm Owen
 Mike Wuerthele and Malcolm Owen

 William Gallagher