Examining Apple's staggering $111.4B holiday quarter by the numbers
 Malcolm Owen
Apple's Q1 2021 results were the highest ever for the Cupertino giant, with a later iPhone release schedule and many other factors supersizing typically huge results. Here's a breakdown of the key figures Apple disclosed about its holiday quarter fortunes.
On Wednesday, Apple held its usual release and analyst conference call to discuss its holiday quarter results. Usually, the quarter proves to be high-earning due to seasonality, but other elements came into play to help push the company to new heights, and into the hundred-billion-dollar range of revenue for the first time.
Revenue and Net Profit

For the quarter, Apple disclosed it had earned $111.4 billion in total revenue across all of its businesses. This set a new record for the company among others, eclipsing its previous-highest revenue of $91.8 billion from Q1 2020. This represented an improvement of 21.4 % year-on-year, which is also the highest YoY increase in quarterly revenue for the company since Q4 2015.
The graph shows Apple's ongoing growth, as well as its extreme seasonality for revenue, driven by iPhone releases. Of all of the quarters in a year, Q1 has always been the highest for Apple, and was the most likely candidate to go past the $100 million revenue milestone.
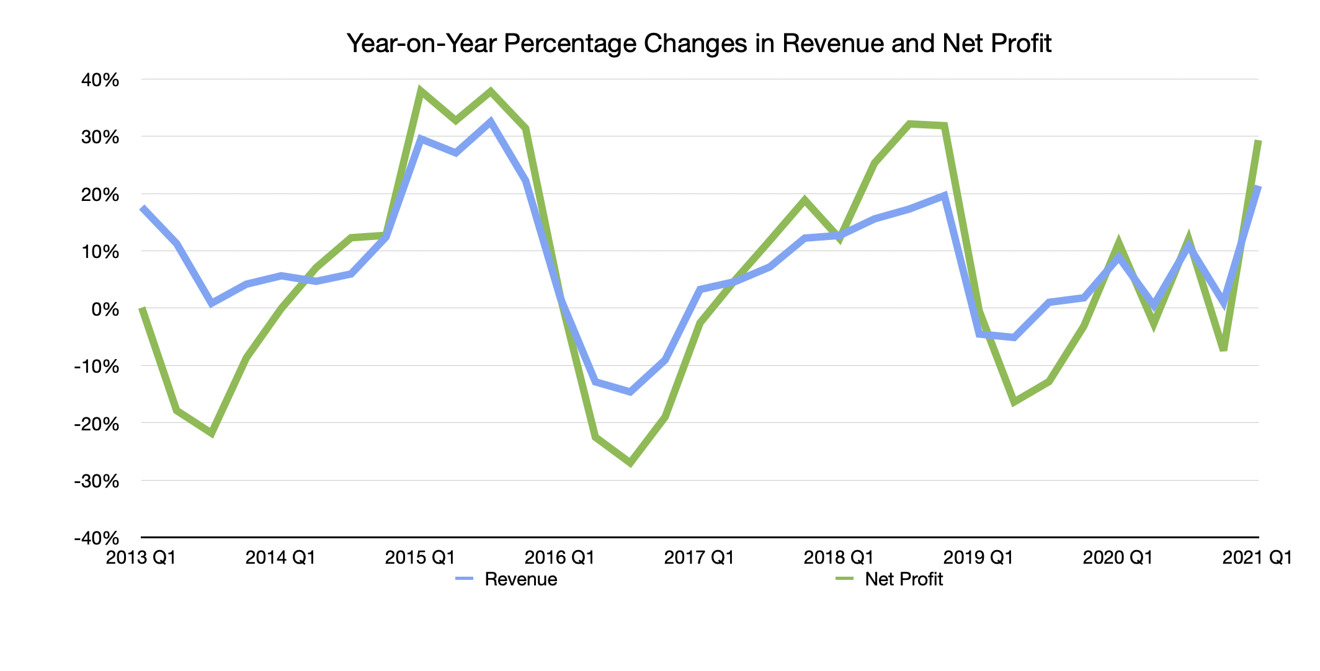
Net profit increased to $28.8 billion, which is an increase of 29.3% year-on-year. This increase in net profit relative to revenue may be good for investors, as it may show that Apple is earning more profit in general than last year.
Gross Margin
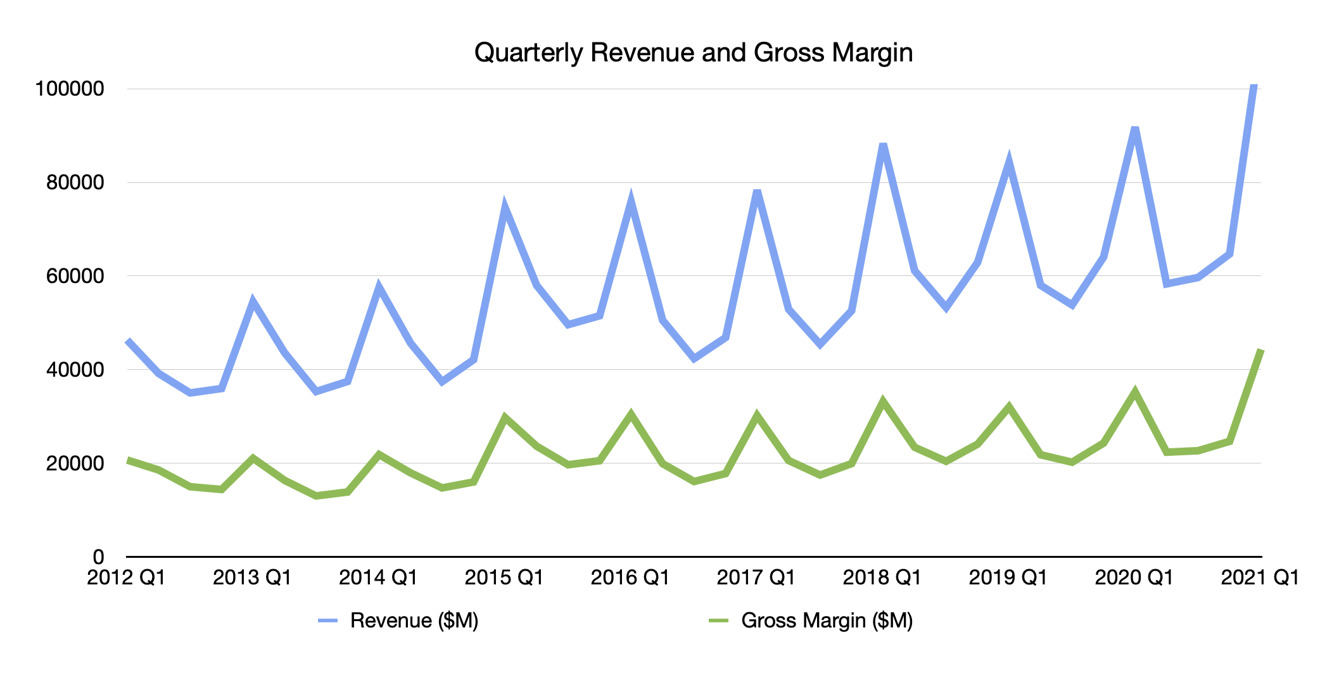
The gross margin is also typically a good indicator of Apple's profitability. For Q1 2021, the gross margin of $44.3 billion is up 25.9% from the same period in 2020.
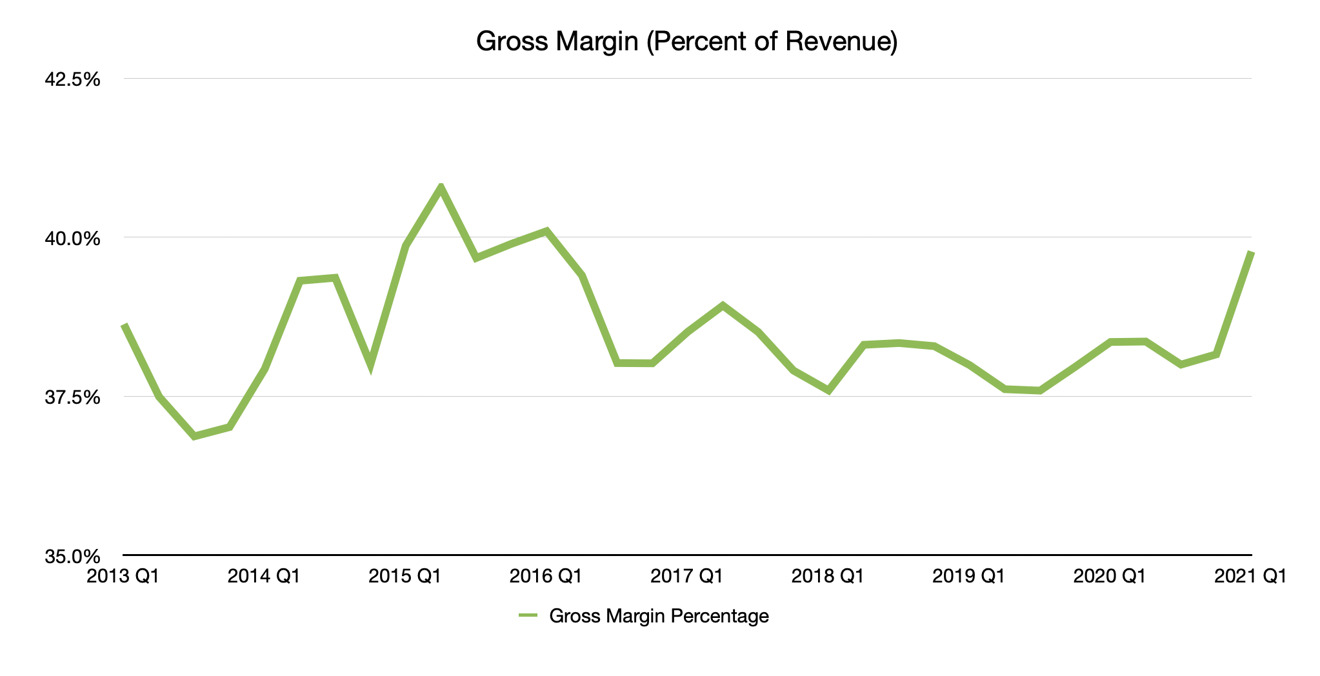
As a proportion of revenue, the gross margin percentage is 39.78%. This isn't as massively exciting as the net profit increase, as gross margin generally sits in the range of 37.5% to 40%, and while the quarter is certainly at the high end of the range, it's still below 40%.
The last time Apple saw a gross margin percentage above 40% was Q1 2016, when it hit 40.1%.
Products
Regular observers of Apple's financial results will be familiar with the way Apple's product revenue is dominated by the iPhone, and for Q1 2021 there's no exception. Putting all of the product categories together, there's obviously a difference in how much iPhone pulls in over the rest.
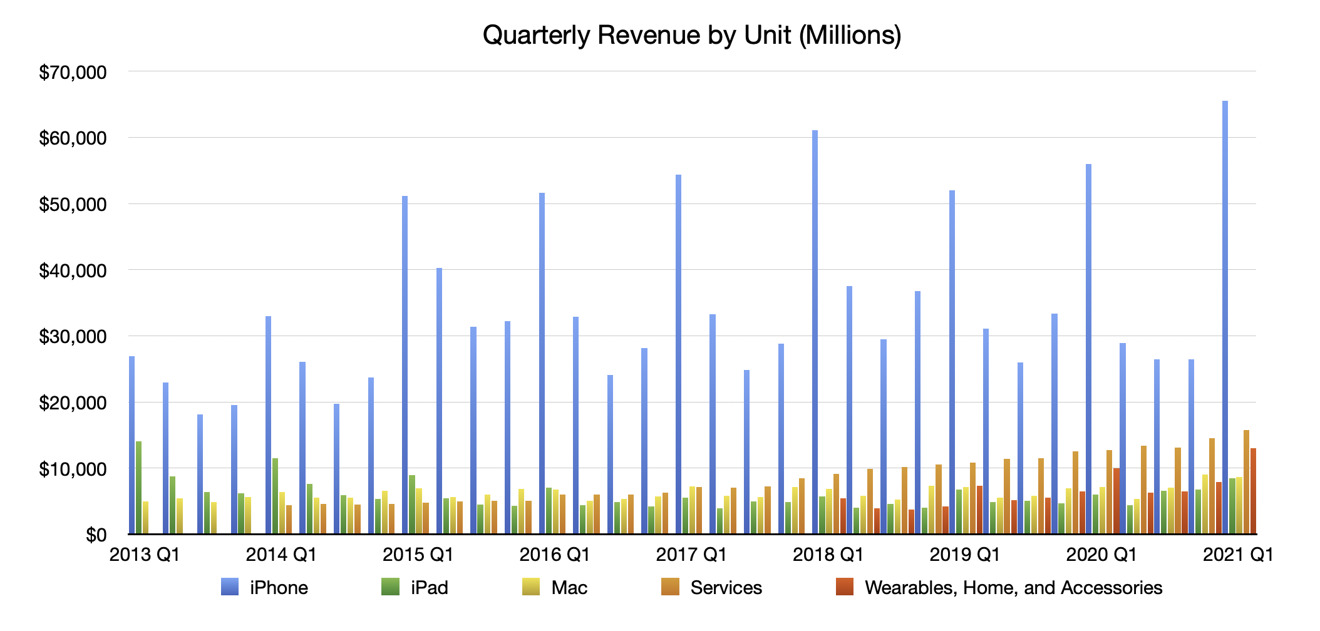
Even so, it is worth keeping track of the Services and Wearables, Home, and Accessories units, as they are continuing to steadily grow.
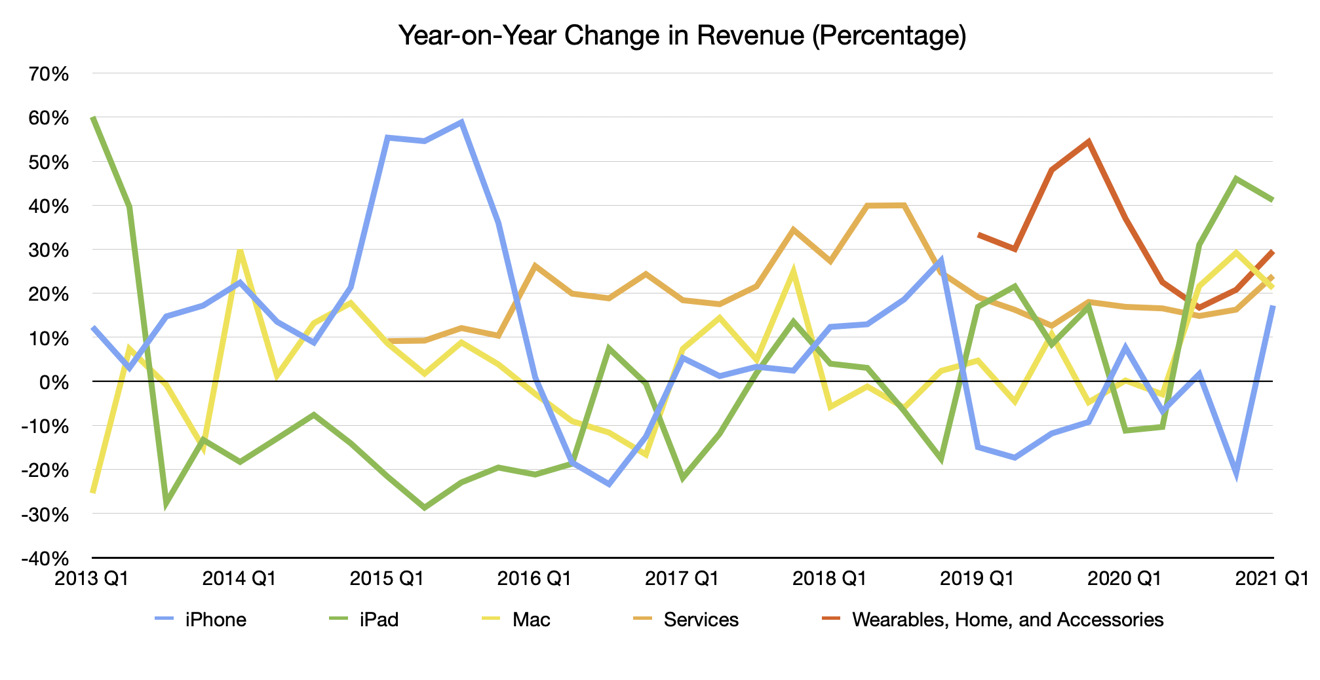
Following a year of COVID-19 and increased demand for hardware, it is to be expected for all of Apple's arms to see positive revenue changes over the previous year. The outlier of the group is iPad, which has enjoyed stellar sales for the period.
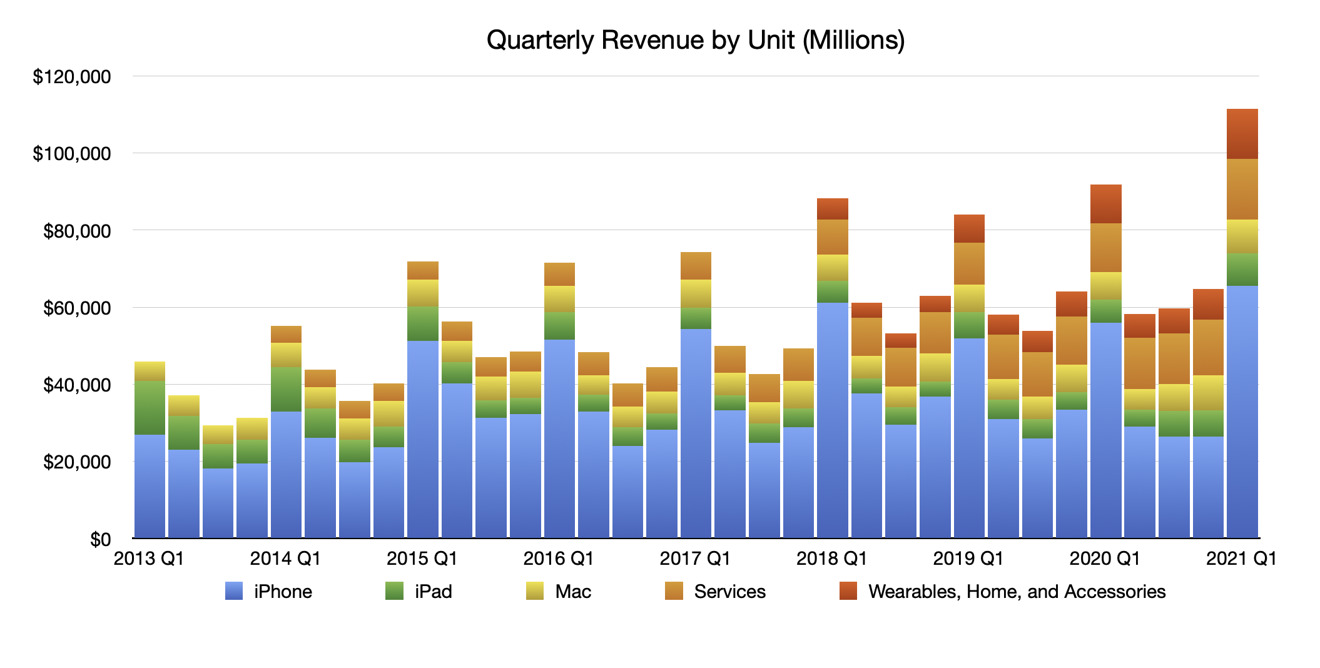
In this graph, it's much easier to see the growth of the Services and Wearables, Home, and Accessories arms from quarter to quarter, generating a larger proportion of revenue each time.
iPhone
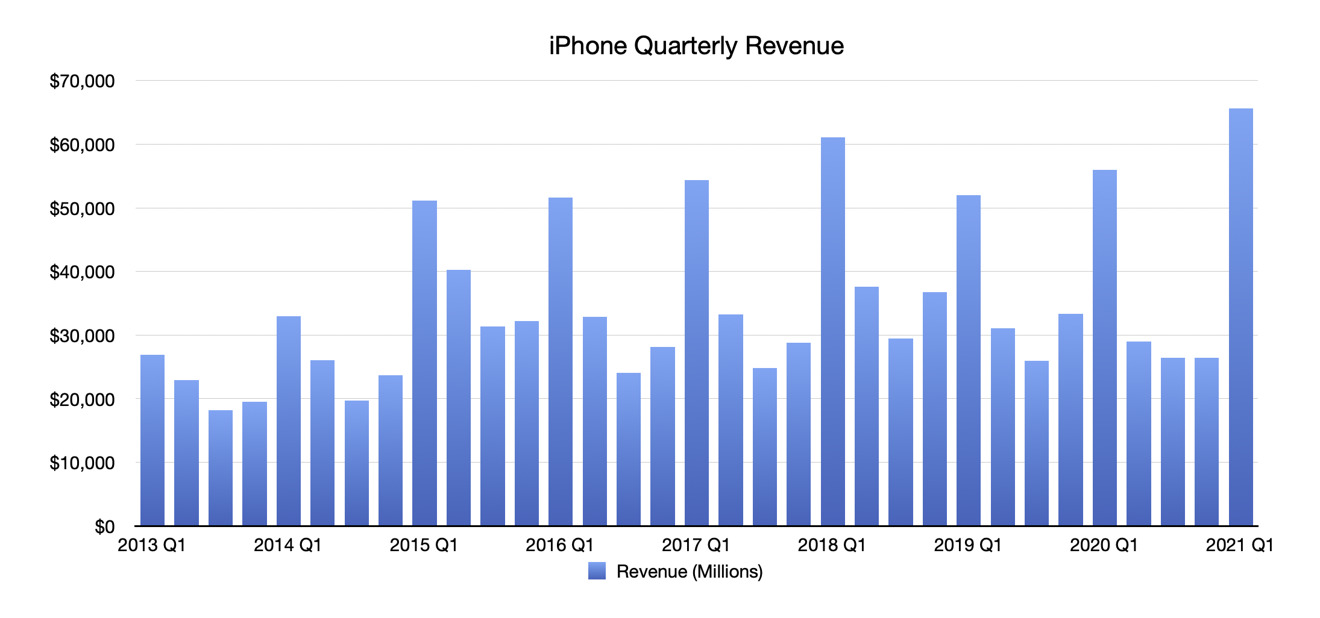
The later launch of the iPhone 12 range in the quarter helped boost the holiday quarter's sales a bit, rather than affecting the tail-end of the previous quarter. This, as well as higher demand for the more expensive models, improved the revenue for the quarter to $65.6 billion, up 17.2% year-on-year.

Apple CEO Tim Cook is confident that there's more room to grow, as "everybody doesn't have an iPhone," as well as the company not reaching a majority share in any market as yet. Cook did comment that there are now over 1 billion iPhones in active use, which will help its Services arm grow.
iPad
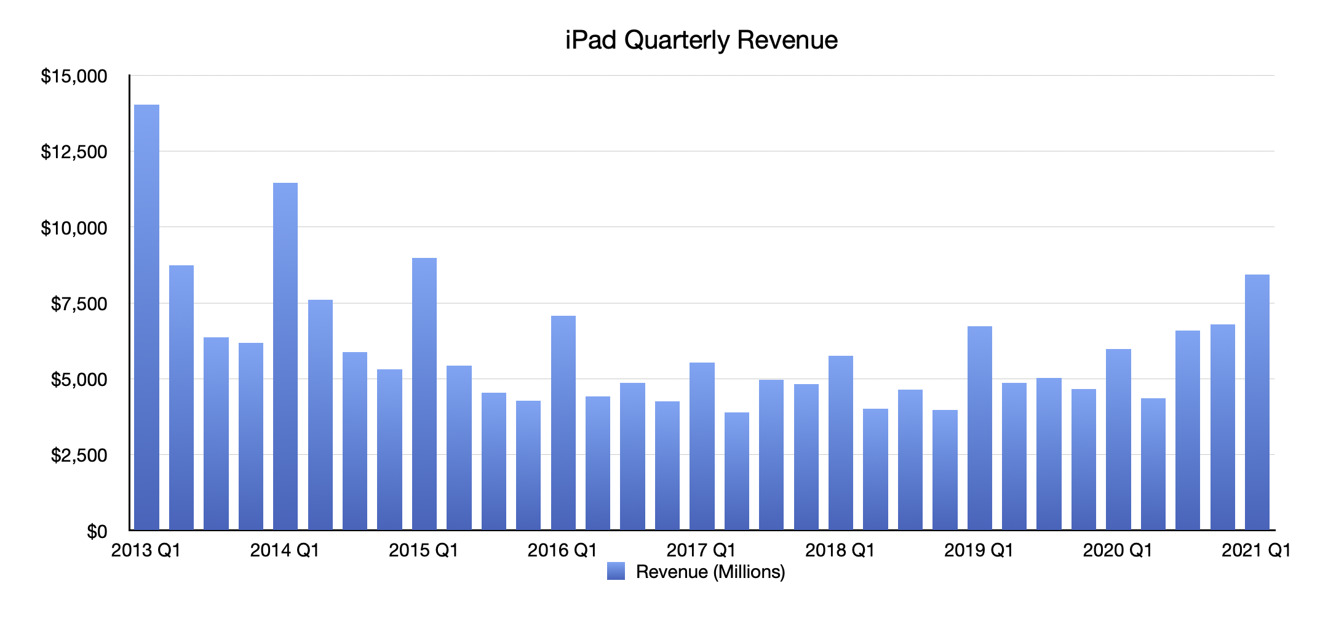
While not as high-revenue as the iPhone, it's probable many would consider the iPad to be the most impressive unit for the company in the quarter. While its $8.4 billion is a far cry from the iPhone revenue, it's also a staggering 41.1% YoY increase.
Even more sod, this follows the Q4 quarter, when the unit saw a 46% YoY growth spurt, again driven by COVID-19 social distancing and work-from-home initiatives.
Mac
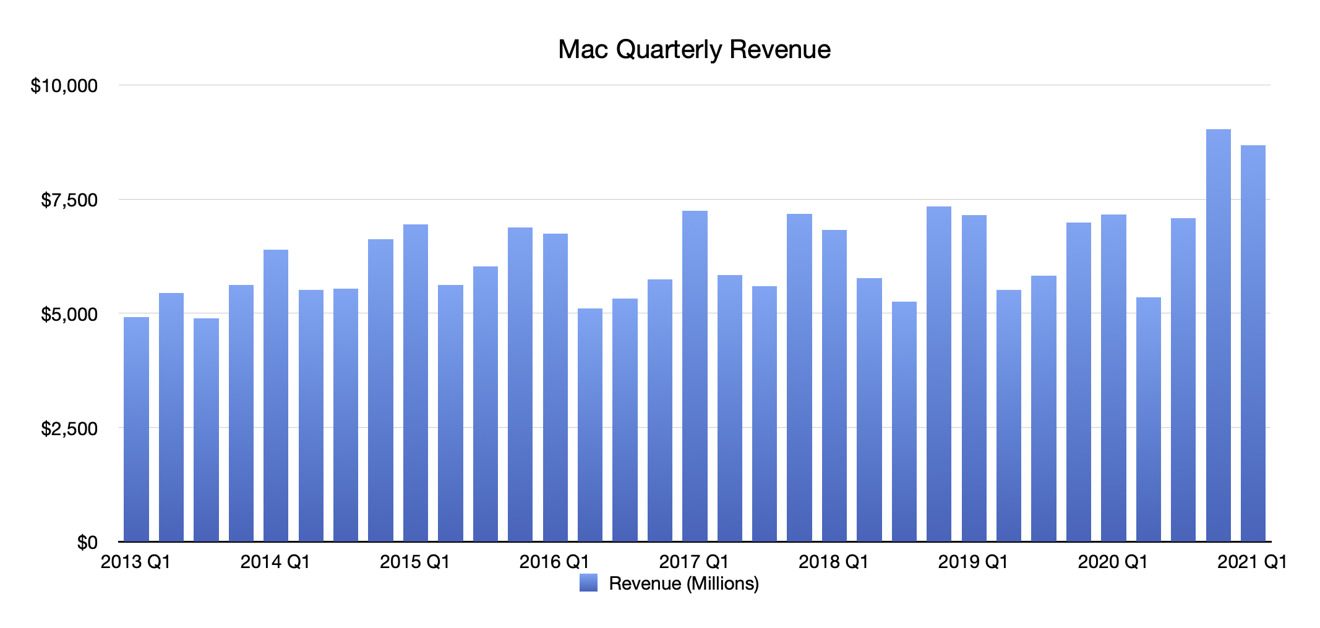
Much like the iPad, the Mac segment continued to benefit from social distancing measures, and has done so for the third successive quarter. Revenue of $8.7 billion gives it growth of 21.2%, which isn't quite the 29.2% seen last quarter, but still considerably better than Q1 2020's "growth" of 0.2%.
Services
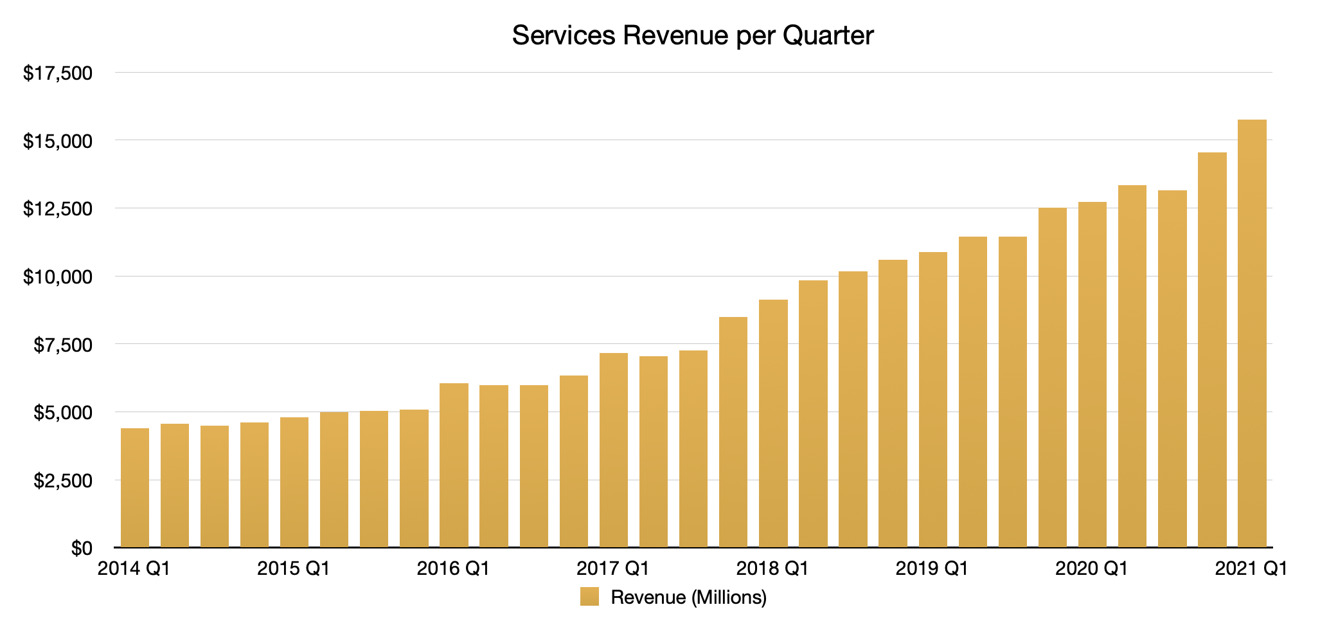
The Services arm has always been a reliable business for Apple since it started counting it as its own segment in 2014. For Q1 2021, it's reached its highest level, at $15.8 billion of revenue, with it again most likely benefiting from people staying at home and using their devices more often.
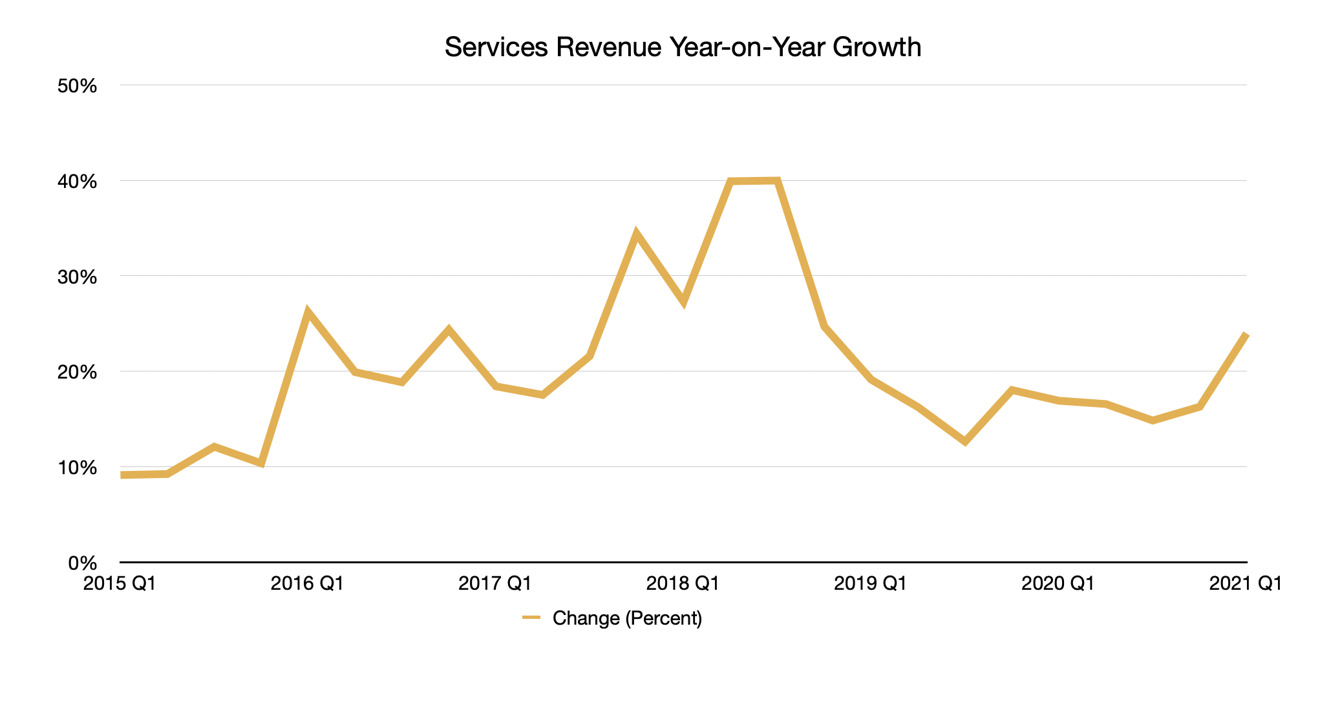
More importantly for Services, this is yet another quarter that it saw YoY growth. Furthermore, at 24%, it's a considerable improvement over the sub-20% growth seen in the last eight quarters.
Unlike the other physical product-led categories, the Services arm is more likely to be a stable financial source for Apple, since it relies on devices that are in use for App Store purchases and subscriptions, rather than hardware sales. While other categories may wane in the future, Services will probably keep chugging along for a long time without too much change, short of a major negative event for the company.
Wearables, Home, and Accessories
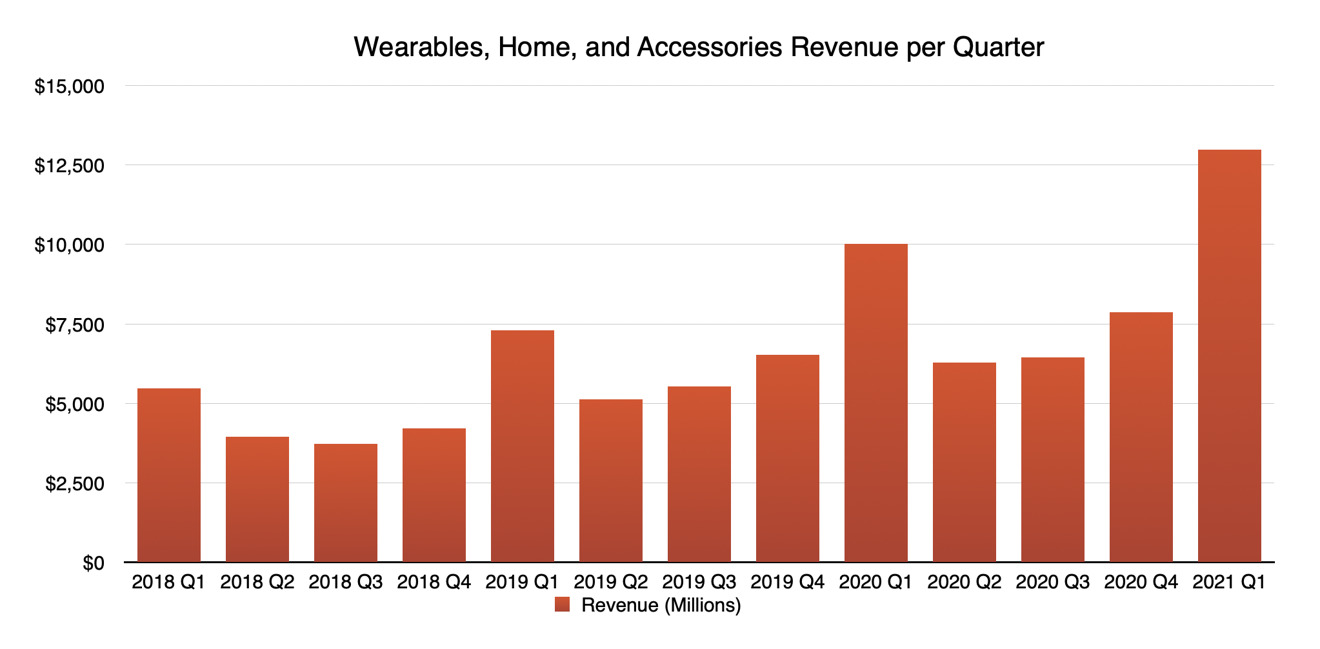
The relative newcomer to the units, the Wearables, Home, and Accessories category is still seeing high revenue gains, exceeding $10 billion for the second time with $13 billion. Within a few years, the category, which covers AirPods, the Apple Watch, and other products, has managed to more than double in value for the company, eclipsing iPad and Mac with Services firmly in its sights.
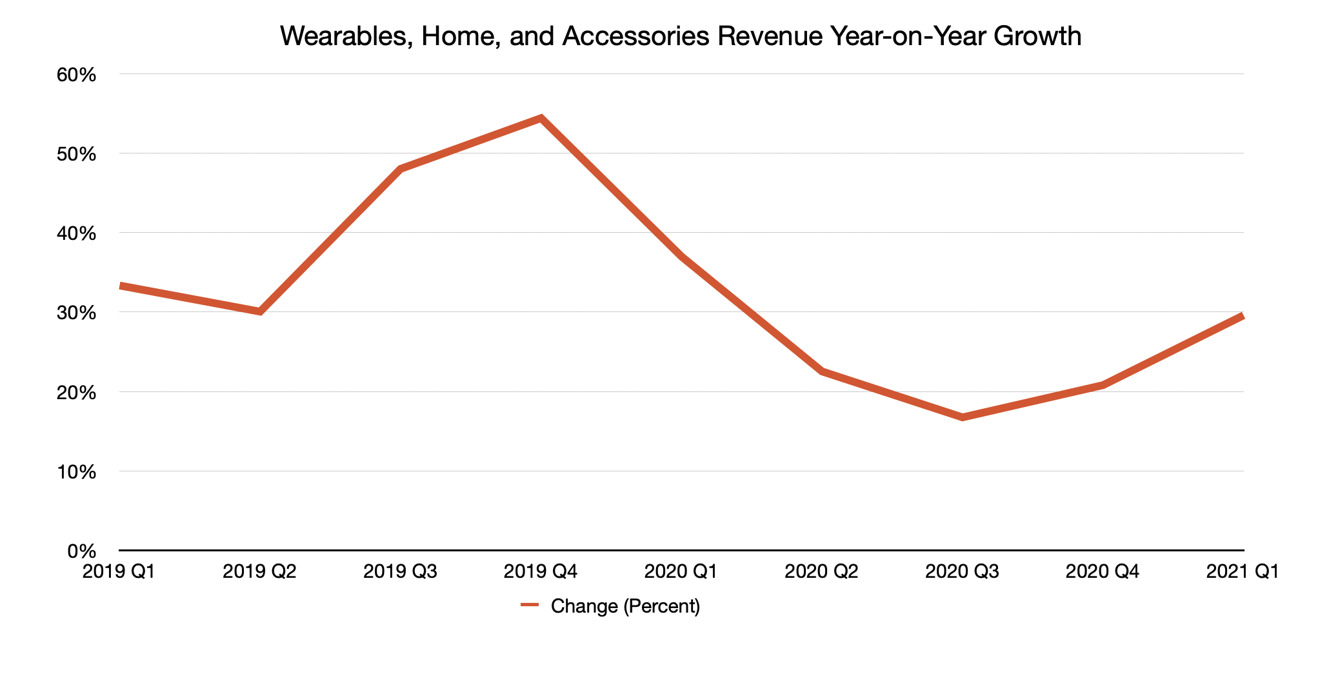
Much like Services, this category is enjoying considerable year-on-year growth that is quite reliable, but with higher percentages. For the quarter, it saw 29.6% growth YoY, a percentage that again has likely been influenced by consumer trends prompted by the Coronavirus.
Regional Revenue

On a territorial basis, Apple's main revenue stems from the Americas primarily at $46.3 billion, followed by Europe at $27.3 billion, Greater China at $21.3 billion, Japan at $8.26 billion, and then Rest of Asia Pacific with $8.23 billion.
All regions enjoyed YoY growth, but some are considerably higher than normal. Along with China's massive 57% growth spurt, Japan also saw a YoY increase of 32.8%, with Europe up 17.3% YoY, the Americas with 11.9%, and Rest of Asia Pacific rounding out the group at 11.5%.
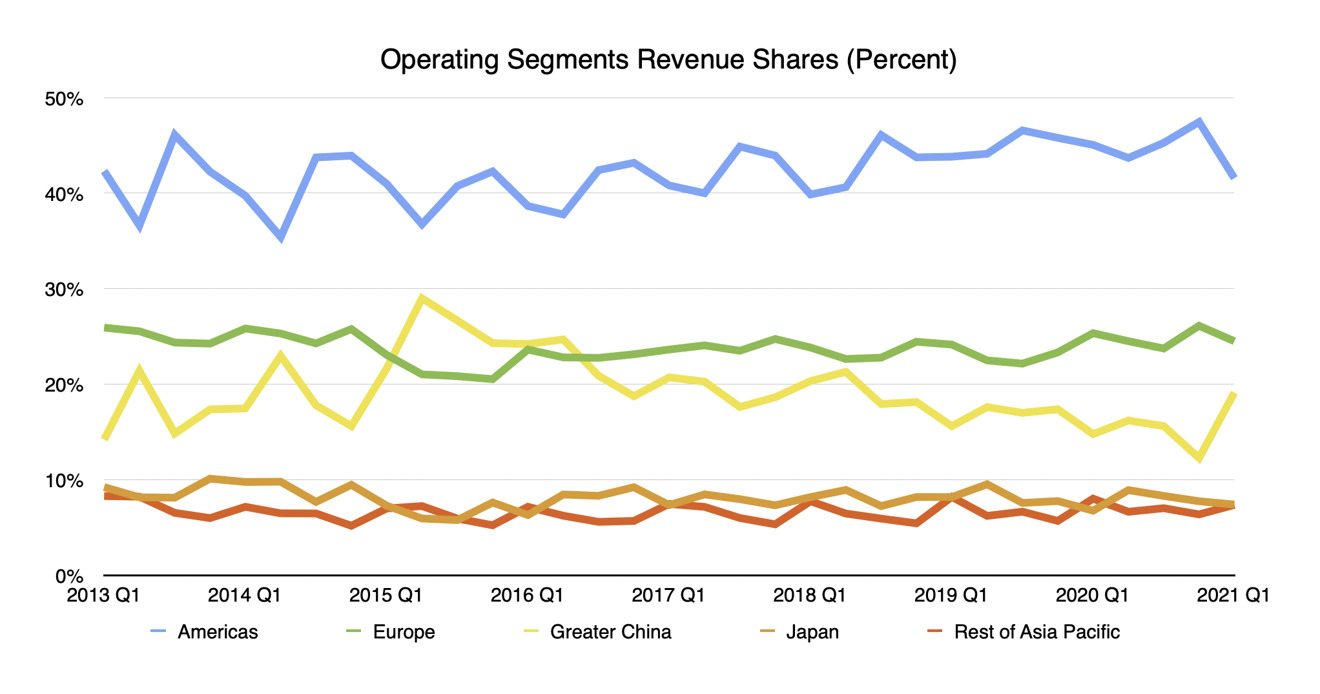
If you look at it in terms of proportional revenue, you can see that both Europe and the Americas dropped by a few percentage points to 24.5% and 41.6% respectively, both for sequential quarters and when put against Q1 2020. By contrast, China saw its revenue share balloon from Q1's 14.8% to 19.1%.
Once again, China is becoming more of a big deal for Apple.
China
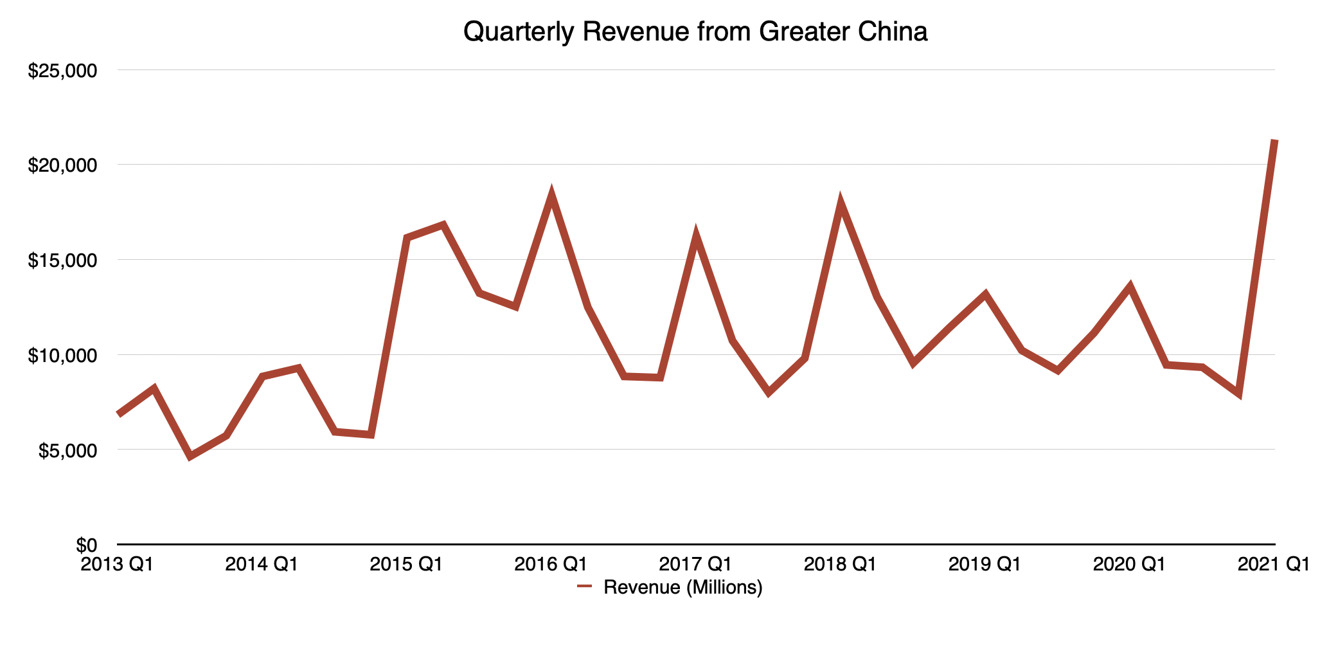
While China is susceptible to the same seasonality as other regions, it is the most volatile among the group. Just looking at revenue in China for Q1 in 2019 and 2020, you can see a drop from what was observed in 2018, something this year's figures firmly counter.
It seems that the last two years were disappointing for Apple, and something about the holiday quarter energized the China market. As Cook said, it was "more than an iPhone story," though he also admitted there was a pent-up demand for a 5G iPhone that helped matters.
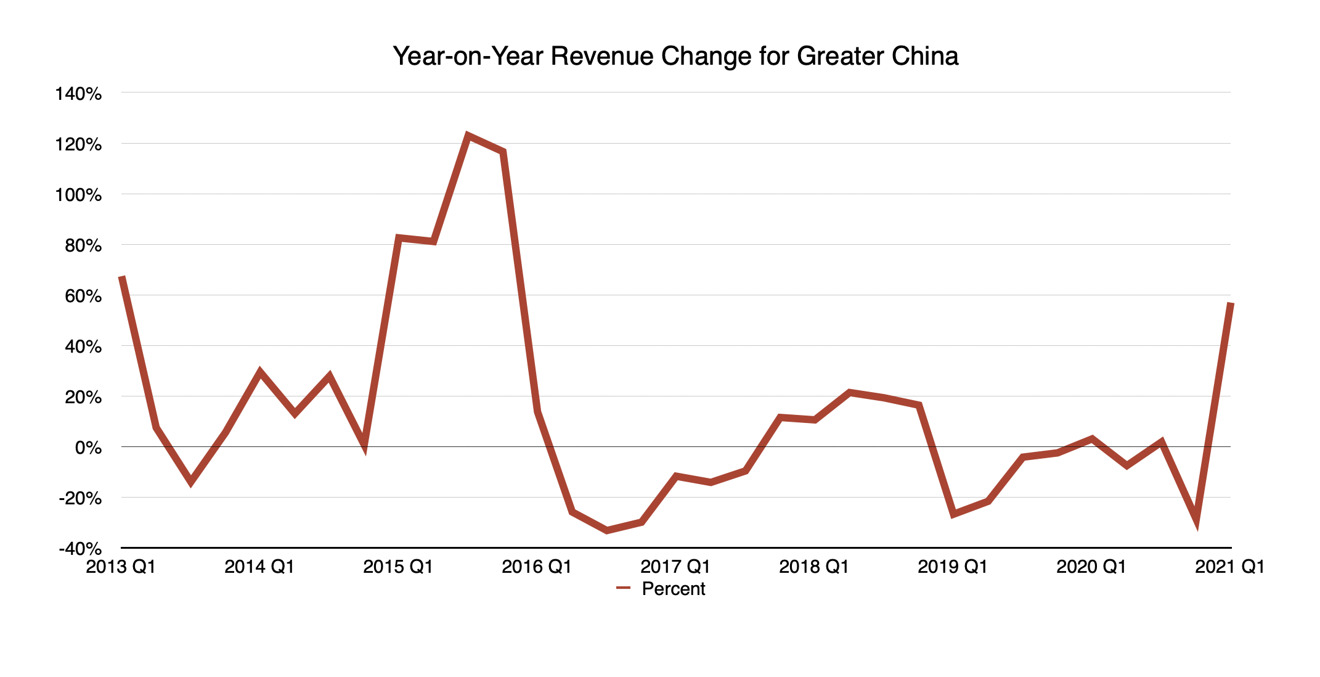
Looking at China's YoY growth, it's plain to see some stagnation in the last few years, a trend the latest results certainly buck. It may be a far cry from the stratospheric growth seen in 2015, but it's certainly a sign such heights are entirely possible for the company in the future, under the right circumstances.


 Andrew Orr


 William Gallagher

 Mike Wuerthele
 Christine McKee