Research firm comScore announced a Device Essentials analytics service earlier this week reporting on digital traffic by device. The study uses "census-level information from tagged web page content" to reveal device usage.
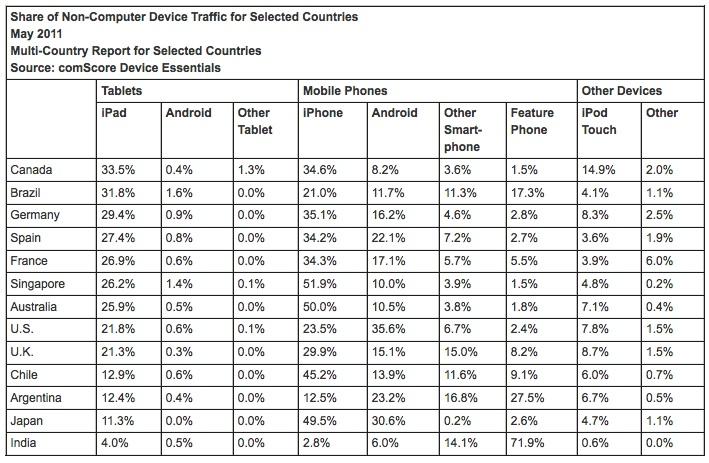
The inaugural report found that Apple's iPad dominates across all 13 geographies tracked, accounting for more than 89 percent of tablet traffic across all markets.
According to the report, the iPad makes up the highest percentage of total non-computer traffic in Canada with 33.5 percent. Brazil is second with 31.8 percent, though it should be noted that non-computer devices comprise less than 1 percent of traffic in the country.
Though Android tablets are way behind the iPad in terms of traffic, Android smartphones led the iPhone with 35.6 percent of smartphone traffic, compared to Apple's 23.5 percent. comScore's data also suggested that iOS users are more likely to access the Internet over a Wi-Fi network than are Android users.
47.5 percent of iPhone traffic occurred over Wi-Fi networks, as opposed to 21.7 percent on Android phones. The vast majority, 91.9 percent, of iPad traffic took place over Wi-Fi, while Wi-Fi usage on Android tablets made up 65.2 percent.
Last month, research group Nielsen published a study that found the iPad has an 82 percent market share of tablets in the U.S. The Samsung Galaxy Tab was second with a 4 percent market share.
A number of analysts expect Apple to lead the tablet market for the "foreseeable future." As of earlier this month, Apple had sold 25 million iPads in the 14 months since the device's launch and is on track to sell more than 8 million units this quarter.
 Josh Ong






 Mike Wuerthele
 Marko Zivkovic

 Malcolm Owen



 William Gallagher
 Amber Neely
 Sponsored Content

-m.jpg)





43 Comments
Funny how all these usage reports cross up a device vs an OS.
Perhaps they would like to list other "manufacturers" instead one vs a multiple.
Interestingly Apple's iPhone leads in 8 out of 11 countries regarding internet usage.
Interestingly Apple's iPhone leads in 8 out of 11 countries regarding internet usage.
Agreed. All these reports and surveys about Android versus iPhone seem to be made up to validate some particular point of view. All these reports of Android sales having long ago overtaken iPhone sales, then a report like this showing iPhone internet usage leading by a wide margin in most countries. A recent AI article states that iPhone is the best selling smartphone in AT&T and Verizon stores. T-mobile says they have a million iPhones on their network even though they don't sell the iPhone and the iPhone isn't even designed to run well on that network.
How can these reports all be true. If Android is outselling iPhone it doesn't appear people are using them after they buy them. Someone please explain to me what is going on.
Also it is interesting to note that the Xoom and the Playbook are not even mentioned in the article.
The main point of the article is ipad's percentage of the tablet market (the 89%), but the table seems to show the various operating systems contribution. I just do not see where they get 89% from the data shown. (although this does sound like a conservative estimate as far as the ipads percentage of the tablet market).
You can produce the number for any given market by just taking the iPad number as a percentage of (iPad+android+other tablet).
ie. for the US its (21.8/22.5)*100 = 96%
To produce the global numbers you'd have to weight by market, which Comscore don't provide us the numbers to replicate but we can assume that they have internally.
What's really damning about this number is that it suggests that either the galaxy tab's sell through is even worse than we all thought or perhaps worse still, people who bought it aren't actually using it very much.