 Chip Loder
You can easily keep tabs on what's running on your Mac and get things running smoothly by using Apple's Activity Monitor. Here's how to get started.
Most applications running on UNIX-based systems are called processes, and since macOS is based on UNIX, it is no different. Apple's Activity Monitor app allows you to look at, monitor, and stop most macOS processes running on your Mac.
Activity Monitor ships with macOS and lives in /Applications/Utilities. To run it, double-click it from the Finder in the Utilities folder.
What are processes?
A process in a UNIX-based OS is an app or background daemon which runs to perform some task. Some processes, such as apps have a user interface, others, such as daemons don't.
Apple's Activity Monitor app is a process monitor app which allows you to monitor, and optionally kill apps in a single window.
In UNIX, each process has a pid (process ID), a name, owner (user or another process), threads (paths of execution), and runtime.
Using Activity Monitor on macOS
In Activity Monitor, the app lists all processes running on your Mac, by name, pid, and with columns for % of CPU used, CPU time, number of threads, number of times the process was awakened from sleep, % of GPU used, and owner.
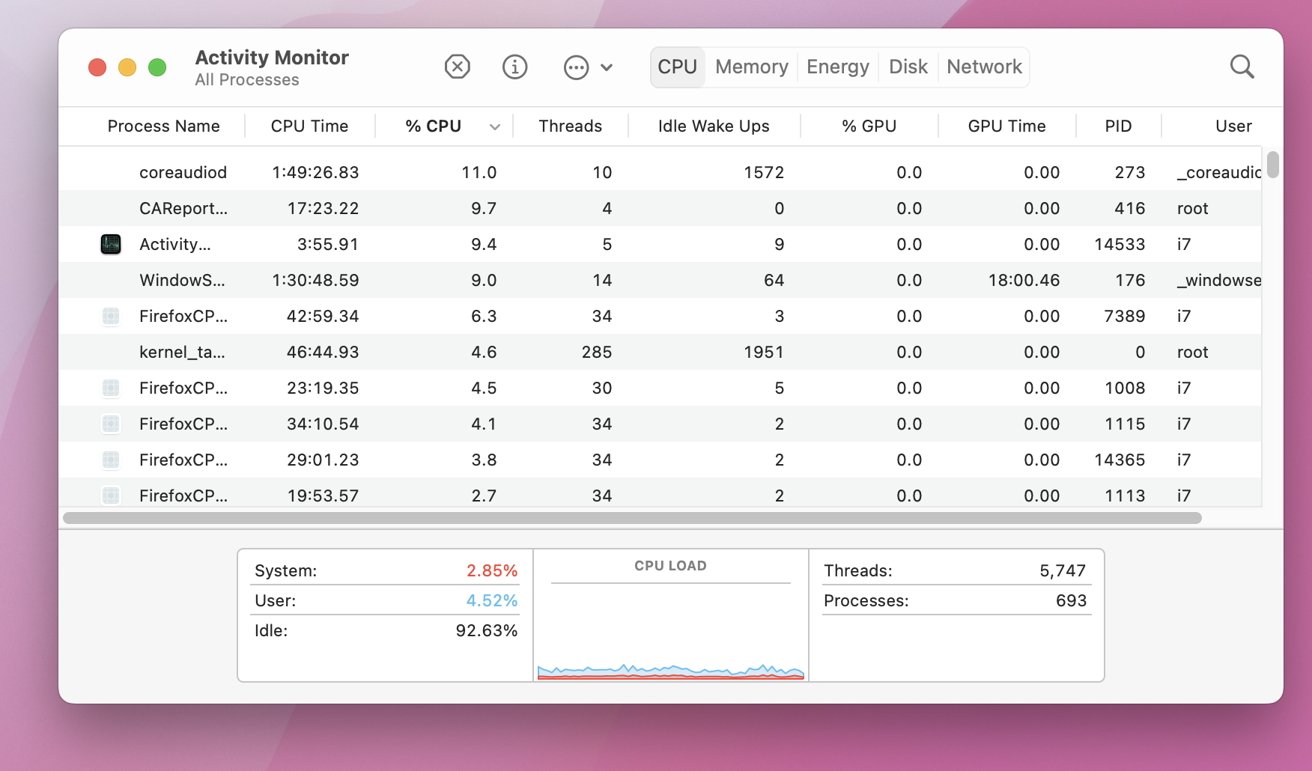 An Activity Monitor window.
You can sort the data from highest to lowest by clicking on any column's title, and you can reorder the columns by dragging them by their titles.
You can also switch the app's display to Memory, Energy, Disk, and Network displays by clicking any of those tabs at the top of the window.
To the left of the tabs area are three buttons: Stop (kill), Get Info, and a Sample/Diagnostic popup menu. Stop is the Terminal equivalent of the UNIX kill command. Type man kill' and press Return in Terminal for more info:
man kill
To stop a process, select it from the Activity Monitor list and click the Stop button.
The system will end the process, but be aware that for some daemons, the system may immediately restart them even if you kill them. Some daemons are required by the system and it will do everything it can to keep them running.
To Get Info on a process, select it in the list, and click the Get Info button. A new info window opens. Each info window shows Memory used, Statistics, and if the process is an app, any open files and ports the app may be using:
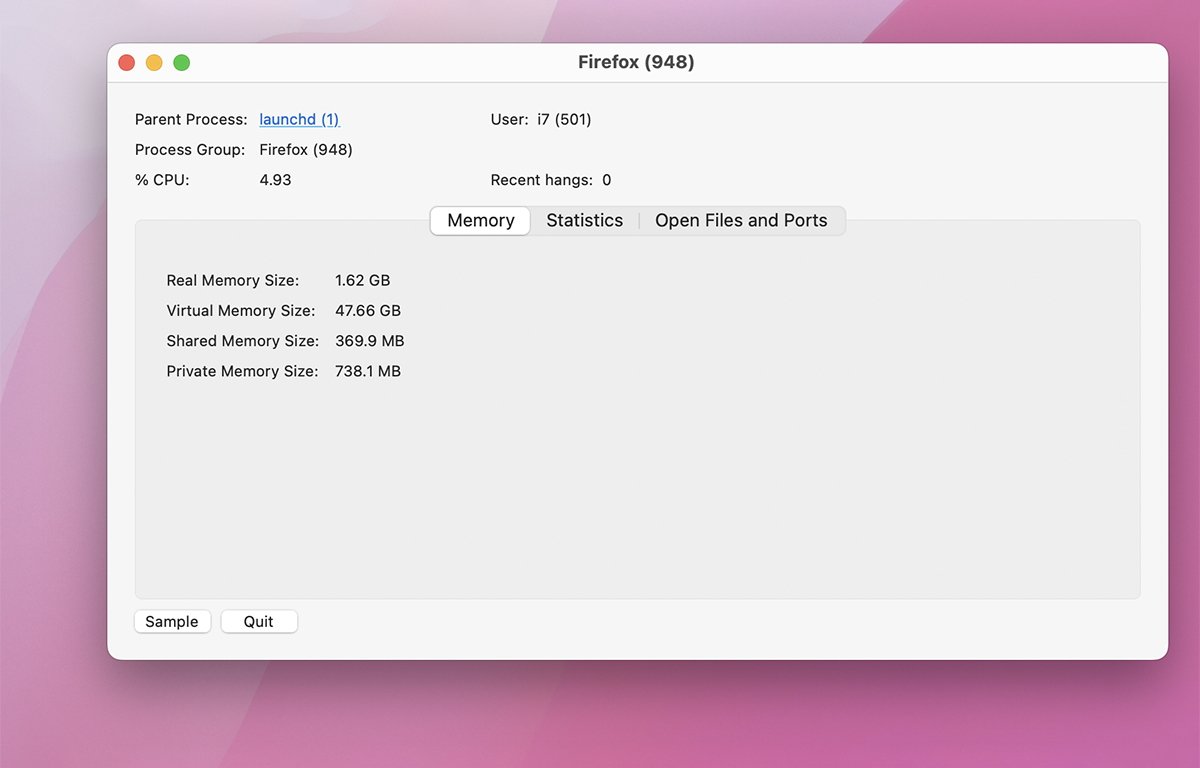 A Get Info window.
If you click the Sample button at the bottom of a Get Info window, it will make a snapshot of the process and dump the snapshot info to another window. The sample contains a total time for the sample, call stacks for each thread in the process, and limited call stack history including which frameworks were called:
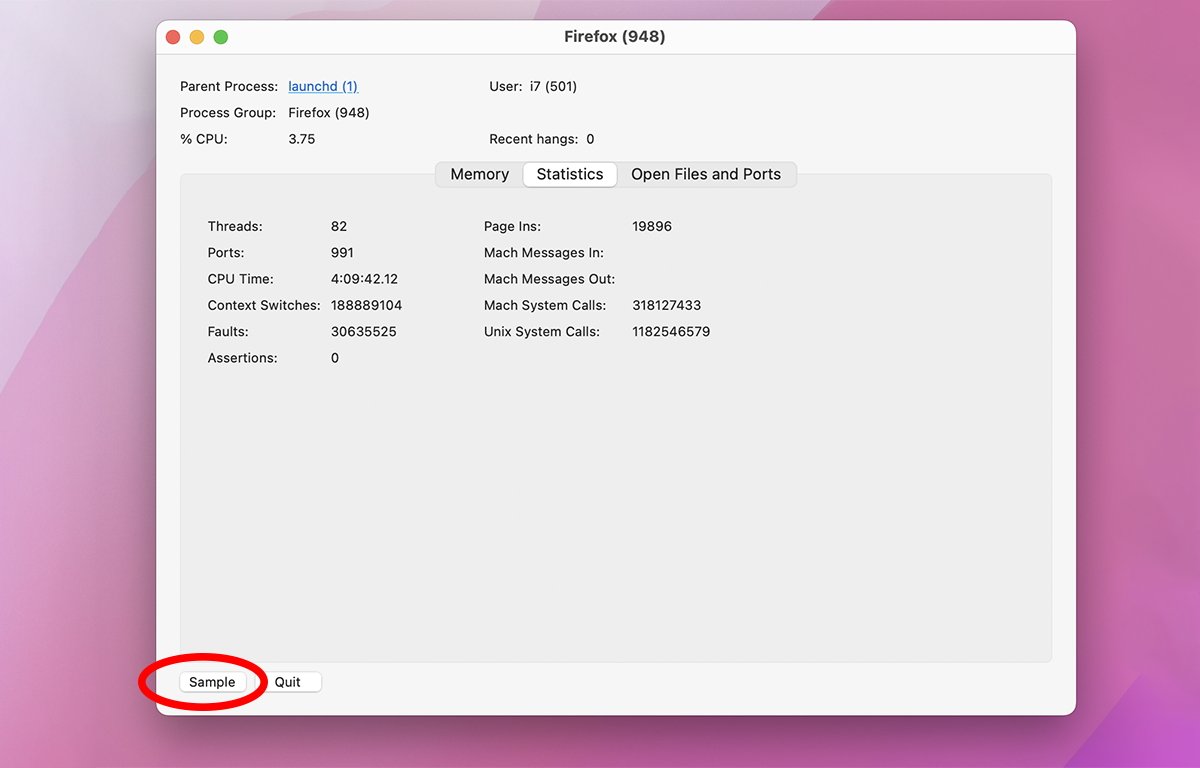 Click the Sample button.
Clicking the Statistics tab shows number of threads, ports, CPU time, content switches, faults, and assertions (errors). The Statistics pane also shows the number of memory page-ins, Mach system calls (Mach is the macOS kernel), and UNIX system calls.
You can also view most of this same info in Terminal by typing:
top and pressing Return.
See 'man top' in Terminal for more info on how to use top:
man top
At the bottom of the Activity Monitor window is a small graph that displays System load, user process load, % idle, and total running Threads and Processes.
Spindumps
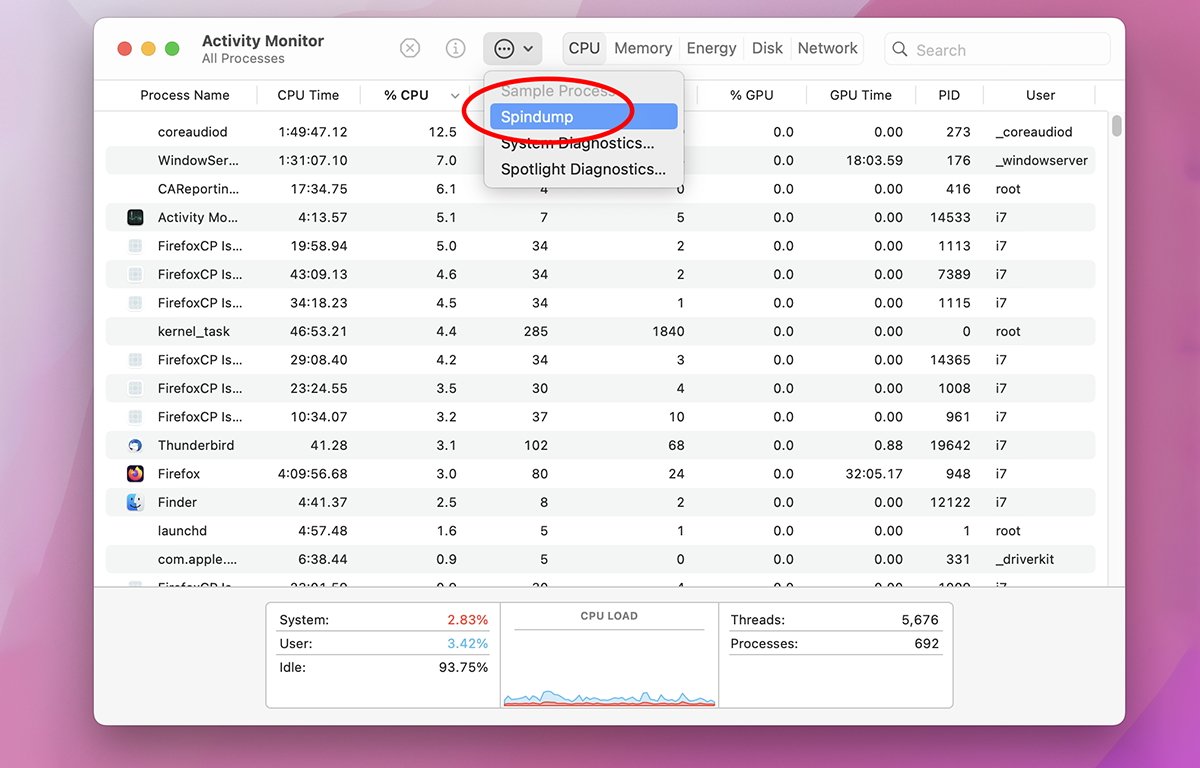
If you click the Sample/Diagnostic popup menu button at the top of the Activity Monitor window, and select "Spindump", the app will generate a report similar to the Sample button in Get Info windows, but for all processes running on your Mac:
Additional views and graphs
There are far more viewable columns possible than the default ones, and you can toggle them on and off by selecting them from the View->Columns submenu. You can also display a live Dock icon, change the update frequency, filter by process type, and clear the CPU history on the View menu.
On the Window menu, there are three additional menu items which can display CPU History, CPU Usage, and GPU History graphs in separate floating windows:
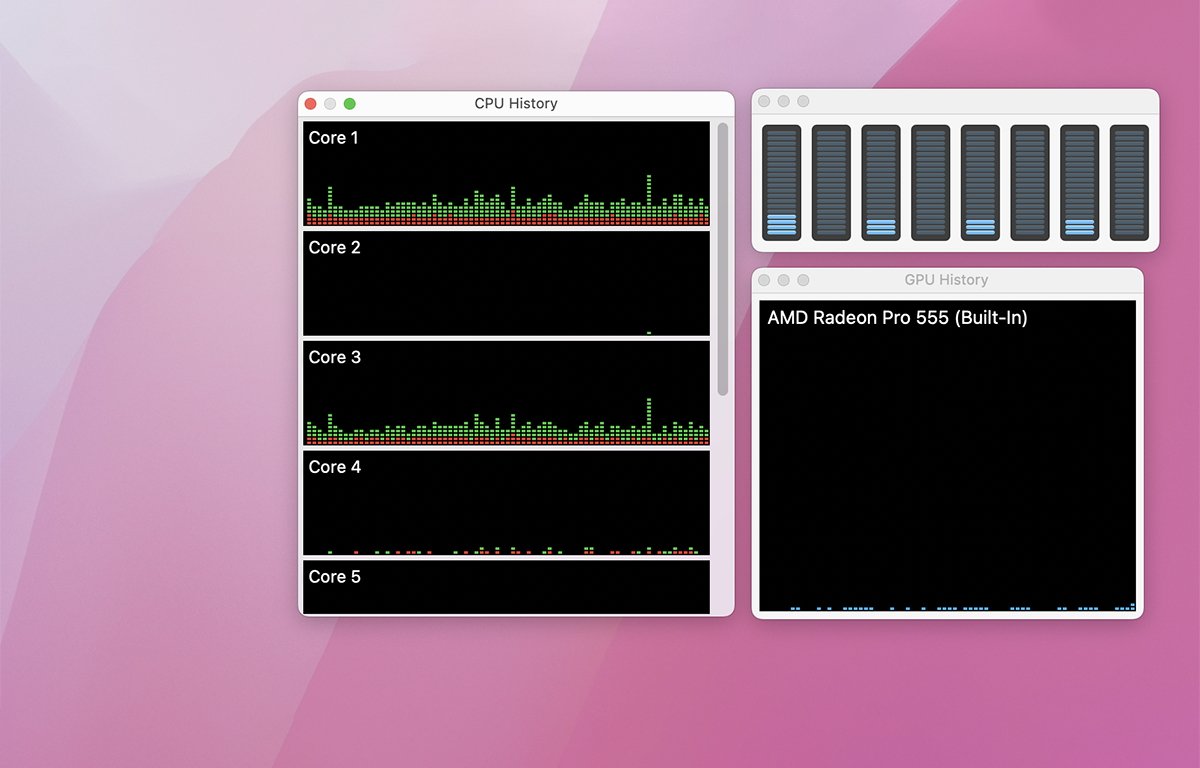
You can also display these windows by selecting the same menu items in the Dock by Control-clicking or right-clicking on the Activity Monitor icon, and then going to the Monitors submenu. You can also change the live Dock icon on the Dock submenu's Dock Icon submenu:
Apple has an online Activity Monitor User Guide, which explains the app's functionality in much more detail.
Activity Monitor makes it easy to monitor process, CPU, and GPU usage, kill processes, and monitor energy and disk usage on your Mac.


 Marko Zivkovic
 Malcolm Owen


 William Gallagher
 Amber Neely
 Sponsored Content

-m.jpg)