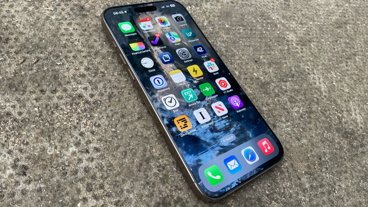
A new study of iOS users has revealed how iPad and iPhone adoption break down among specific groups of people, providing some insight about what Apple's most popular portable devices are being used for.
Analytics firm Flurry revealed the results of its latest survey on Friday, comparing the share of iOS device use by an individual's "persona." These identifiers include categories such as "business professionals," "TV lovers," and "bookworms."
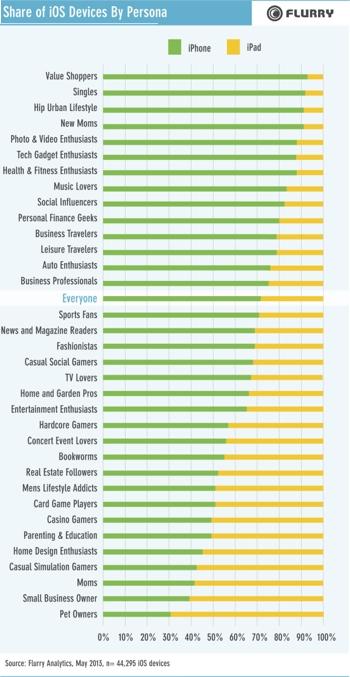 The study found that iOS use skews most heavily in favor of the iPad among "pet owners," about 70 percent of which use Apple's tablet. The next most popular demographic for the iPad was "small business owners," of which more than 60 percent skew iPad.
The third group slanted most in favor of the iPad over iPhone was moms, while "casual simulation gamers" came in fourth, and "home design enthusiasts" took fifth. From there, the split among iPhone and iPad is about 50-50, before the iPhone begins to dominate among "entertainment enthusiasts."
The share of iOS devices by persona is most heavily in favor of the iPhone among "value shoppers," while "singles" come in second and "hip urban lifestyle" took third. The data shows that "on the move" personas are more likely to be on their iPhone, while the iPad's larger size make it less ideal for mobile activities.
Among time spent on each device, the iPad is most popular for education, Apple's Newsstand feature, games, and reference. Meanwhile, the iPhone is iOS users' go-to choice for navigation, health and fitness, and photo and video.
As for the time of day, iPad use peaks in the evening, between 6 p.m. and 11 p.m. The iPhone also peaks during that same period, but user engagement remains higher at later hours after 10 p.m. Flurry suggests that this use shows iPhone users who have their device at bedside, or active people who may be out for a late night.
The data comes from a random sample of 44,295 iPad and iPhone users gathered during the month of May. iPod touch users were not included.
 AppleInsider Staff


 Andrew Orr
 Christine McKee
 Sponsored Content
 Wesley Hilliard

 Amber Neely



19 Comments
Pet owners, lol. Dumb surveys.
I wonder what the demographics of android users would be ?
Homeless, hunters, and dads.
Homeless, hunters, and dads.
Average Androidian: Geeks, tweakers and cheapskates.
Content creators conspicuously absent from the list (e.g., musicians using iOS as a creative tool).
/snort