Millennial Media compared ad impressions for existing connected devices including smartphones, feature phones, tablets and other mobile gadgets that have built-in Internet access, and compiled the resulting data into straightforward statistics.
The real ad battle: iOS vs Android
The Android connected devices and smartphones mix on Millennial’s platform accounted for 56 percent of impressions for the period with iOS coming in second place with 28 percent. BlackBerry followed in third place with 13 percent of ad impressions while Symbian and Windows devices were responsible for just 1 percent of ads each.
Smartphone usage grew 7 percent compared to the second quarter and 37 percent year-over-year. Impressions generated by smartphone web traffic accounted for 72 percent with feature phones and other connected devices including tablets tying for second place with 14 percent each.
In terms of top 15 device manufacturers by impression share, Apple continued to occupy the first position with a 23.09 percent share followed by Samsung and HTC with 16.48 and 15.50 percent, respectively. RIM, Motorola and LG got around 10 percent each, significantly distancing themselves from Huawei and Nokia responsible for 3.05 and 2.41 percent, respectively. The seven remaining companies received under 1 percent of ad impressions: Sanyo, Kyocera, Sony Ericsson, Pantech, KDDI, Sony and a private label.
Among the top 20 mobile phones by impression share, the iPhone retained the number one position with 12.55 percent of ads. Overall, the iPhone accounted for 54 percent of the total number of iOS ad impressions with iPad and iPod touch impressions making up the remaining 46 percent.
Four other smartphones grabbed over 4 percent share each: LG Optimus (6.30 percent), BlackBerry Curve (4.70 percent), Motorola Droid (4.35 percent) and HTC Desire (4.01 percent).
With six Android handsets present in the top 20, HTC accounted for 10 percent of impressions while Samsung grabbed around 5 percent with help of five Android smartphones. RIM’s four BlackBerry handsets got around 10 percent of overall impressions and Motorola received over 7 percent of impressions with two Android devices.
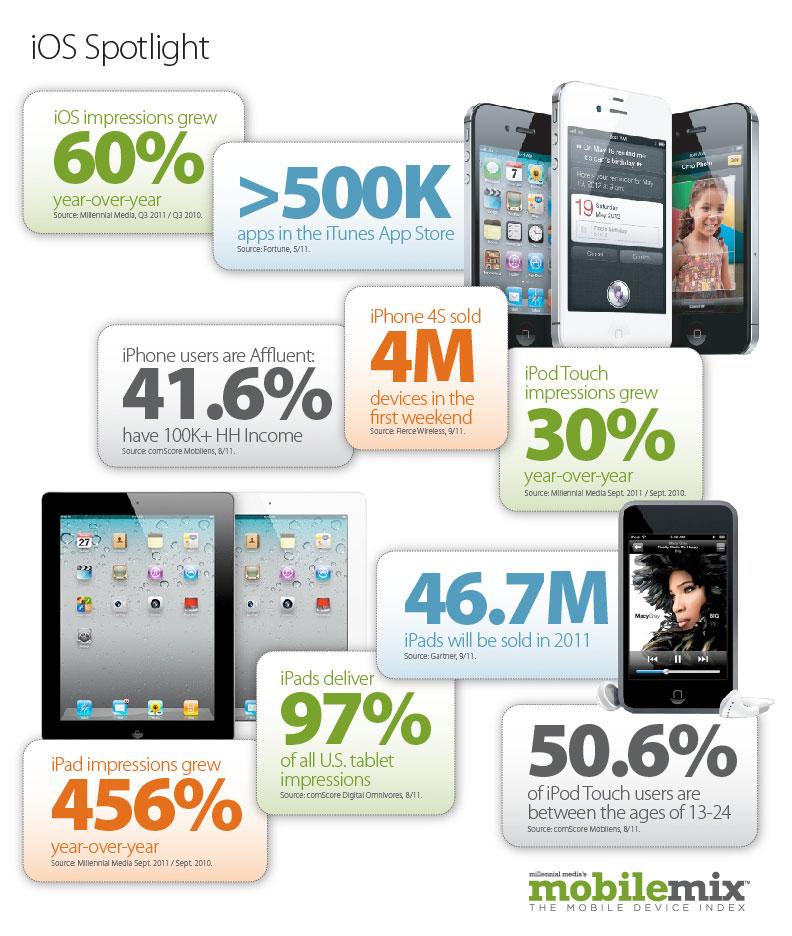
Thanks to the growing popularity of the iPad and iPad 2, iOS managed to top the connected devices category. iPad impressions grew 456 percent year-over-year, delivering 97 percent of all U.S. tablet impressions according to the research cited by the company. The iPod touch impressions also surpassed last year’s performance by 30 percent. Overall, iOS impressions grew 60 percent year over year.
However, Android became the leading connected device and smartphone OS this year thanks to Google’s “contrasting strategy to iOS", the advertising company said. Allowing multiple partners to launch Android devices "at every price point" resulted in a rapid consumer adoption and market share increase.
There’s an ad for that app
With over 500,000 apps available in the App Store, Apple iOS devices were responsible for 41 percent of ad spend for apps in the third quarter. Android surpassed Apple by only 8 percent and showed 20 percent quarter-over-quarter growth. RIM devices got 8 percent and other connected received the remaining 2 percent of ad spend.
The most profitable applications for iOS and Android developers in the third quarter were music and entertainment apps followed by mobile gaming apps. Games still lead the iPad application category and topped the company’s rankings for over the year. Overall, gaming apps impressions grew 26 percent quarter-over-quarter, amounting to a total of 34 percent of application ad impressions.
Apple mobile social networking apps grew 36 percent quarter-over-quarter while the news category was responsible for over 25 percent of impressions across all platforms.
It’s all in the touch
Analyzing the type of user interface of the devices that generated the ad impression in the third quarter, the company concluded that touchscreen-based devices were responsible for 65 percent of ad impressions while "touch and QWERTY" and QWERTY-only devices got 15 percent and 10 percent, respectively. Connected devices equipped only with a numeric keypad accounted for 10 percent of impressions.
Wi-Fi vs Carrier data
Ad impressions resulting from web-browsing over Wi-Fi from mobile devices amounted to 32 percent broken down by devices as follows: smartphones, 59 percent; connected devices, 38 percent; and feature phones, 3 percent.
Meanwhile, ad impressions resulting from Internet usage over carrier 3G and 4G data networks amounted for the remaining 68 percent. Verizon, Sprint, T-Mobile and AT&T devices received 18 percent, 14 percent, 8 percent and 8 percent of the total number of impressions, respectively. Vodafone, Orange, Tim, Bell Canada and others combined were responsible for 7 percent of impressions while smaller carriers including Metro PCS, Cricket, TracFone and Boost Mobile accounted for 14 percent of impressions.
Miscellaneous iOS figures
The study mentioned other interesting details about iOS devices citing Apple’s new launch weekend sales record established by the iPhone 4S, which sold http://www.appleinsider.com/articles/11/10/17/sales_of_apples_iphone_4s_top_four_million_in_first_weekend.html">4 million units in the first three days. The company also revealed that iPad sales are expected to reach 46.7 million in 2011 according to Gartner estimates from September.
Referring to iOS device buyers, Millennial showed that 41.6 percent have over $100,000 income per household and that 50.6 percent of iPod touch users are between the ages of 13-24.
 Chris Smith



-m.jpg)


 Andrew Orr
 Malcolm Owen
 William Gallagher

 Wesley Hilliard

-m.jpg)


14 Comments
Apple’s iPhone and iPad ranked first in various mobile advertising statistics for the third quarter of 2011, beating Android devices despite having only half of Google's market share in connected devices during the period.
.........
The Android connected devices and smartphones mix on Millennial’s platform accounted for 56 percent of impressions for the period with iOS coming in second place with 28 percent. BlackBerry followed in third place with 13 percent of ad impressions while Symbian and Windows devices were responsible for just 1 percent of ads each.
..........
In terms of top 15 manufacturers by impression share, Apple continued to occupy the first position with a 23.09 percent share
What's the point of publishing an article which is so clearly wrong?
First, the title and first paragraph state that iOS leads Android. That is not correct. According to the figures, iOS devices beat any single manufacturer of Android, but TOTAL impressions were 28% for iOS and 56% for Android. Hardly supports AI's headline "iPhone, iPad maintain lead against Android". A more accurate title would have been "Apple maintains #1 position in mobile device ad impressions". Apple does NOT lead Android as the title states.
Second, even the raw data appears to be wrong. Apple has 23.09% share, yet iOS has 28%? Who makes the other 5% of iOS devices if it's not Apple?
is it really too much trouble to get facts correct when all you're doing is regurgitating something that other people have published?
I think its just a matter of time before Android owns the market...Google sure did a number on Apple. Specially Steve Jobs.
and don't discount Windows Phone down the road.
At the moment it looks very much a two horse race with Android clearly the winner, but I cannot believe for one minute that MS will let this one pass by them.
So my best guess is that MS will take more market share from Android than from Apple.
In 5 years things could easily look more evenly spread.
Then clearly the real loser here may be RIM. Android, MS and Apple. 1, 2 and 3 in the future.
What's the point of publishing an article which is so clearly wrong?
First, the title and first paragraph state that iOS leads Android. That is not correct. According to the figures, iOS devices beat any single manufacturer of Android, but TOTAL impressions were 28% for iOS and 56% for Android. Hardly supports AI's headline "iPhone, iPad maintain lead against Android". A more accurate title would have been "Apple maintains #1 position in mobile device ad impressions". Apple does NOT lead Android as the title states.
Second, even the raw data appears to be wrong. Apple has 23.09% share, yet iOS has 28%? Who makes the other 5% of iOS devices if it's not Apple?
is it really too much trouble to get facts correct when all you're doing is regurgitating something that other people have published?
Agreed. Cogent points, JR.