Apple's third-quarter financial results were a significant improvement for 2024. Here's how the figures visually break down in a quarter where Apple soundly beat Wall Street's forecasts.
Ahead of the quarterly results for the third quarter of 2024, Wall Street had predictions that Apple would do better than last year. However, the reality was that Apple soundly beat the forecasts in many areas.
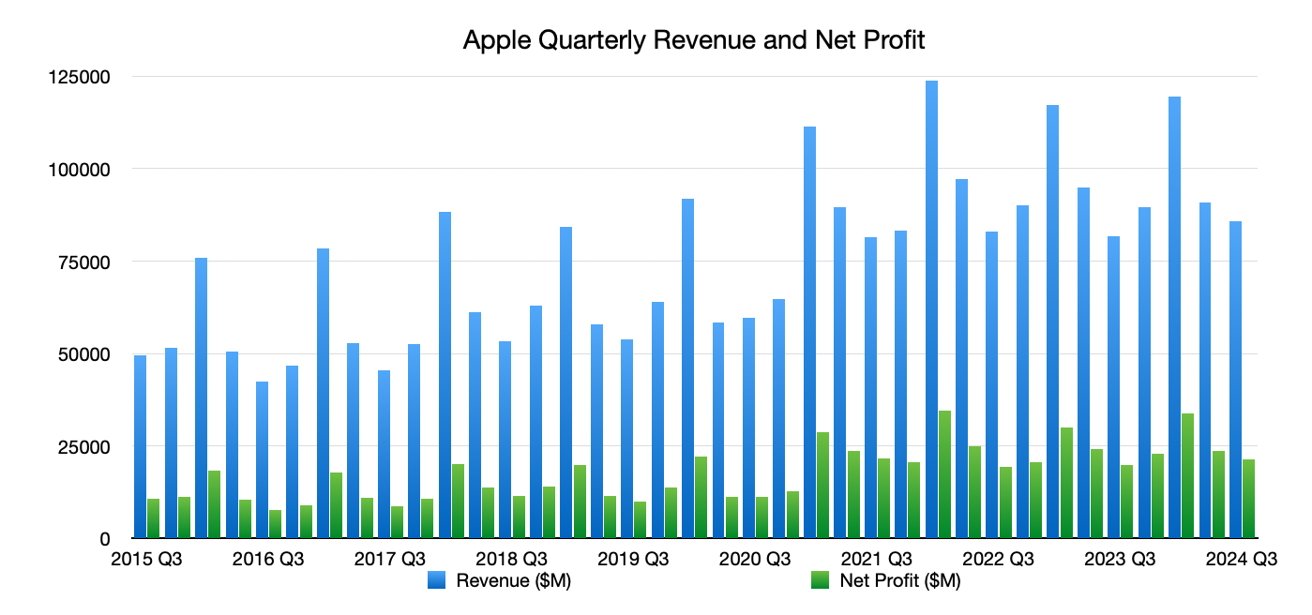
This is the breakdown of Apple's figures for the period compared to previous quarters, providing a fuller picture of Apple's financial journey.
Apple's main financial figures for Q3 2024
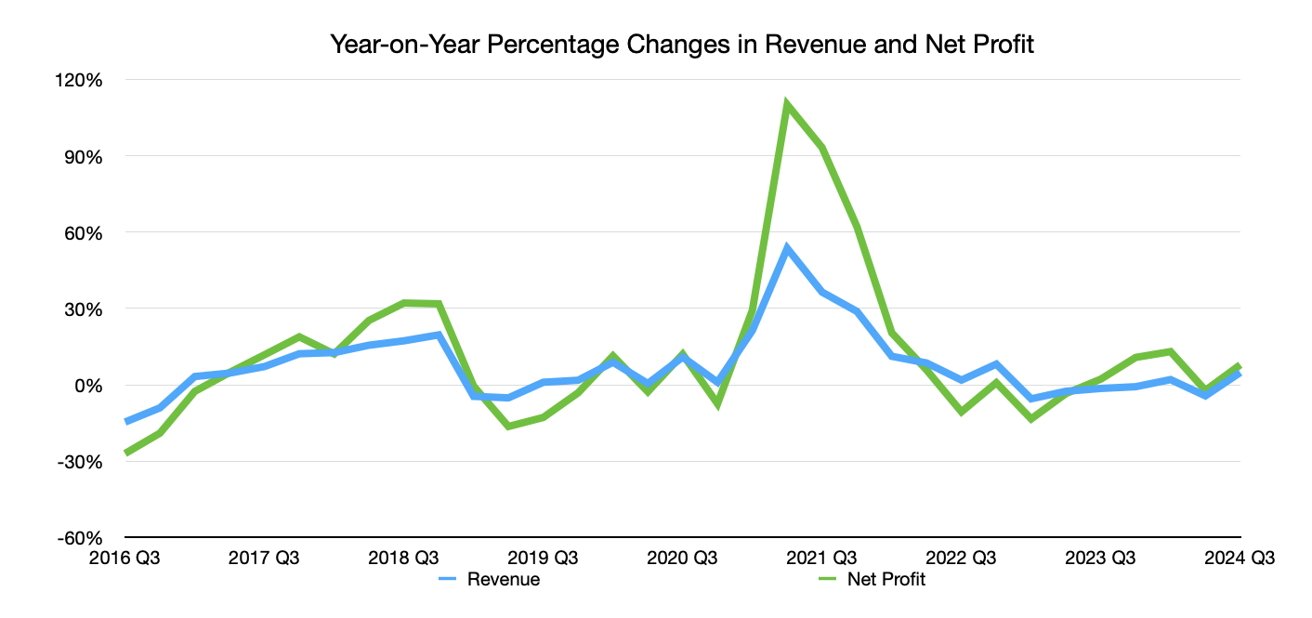
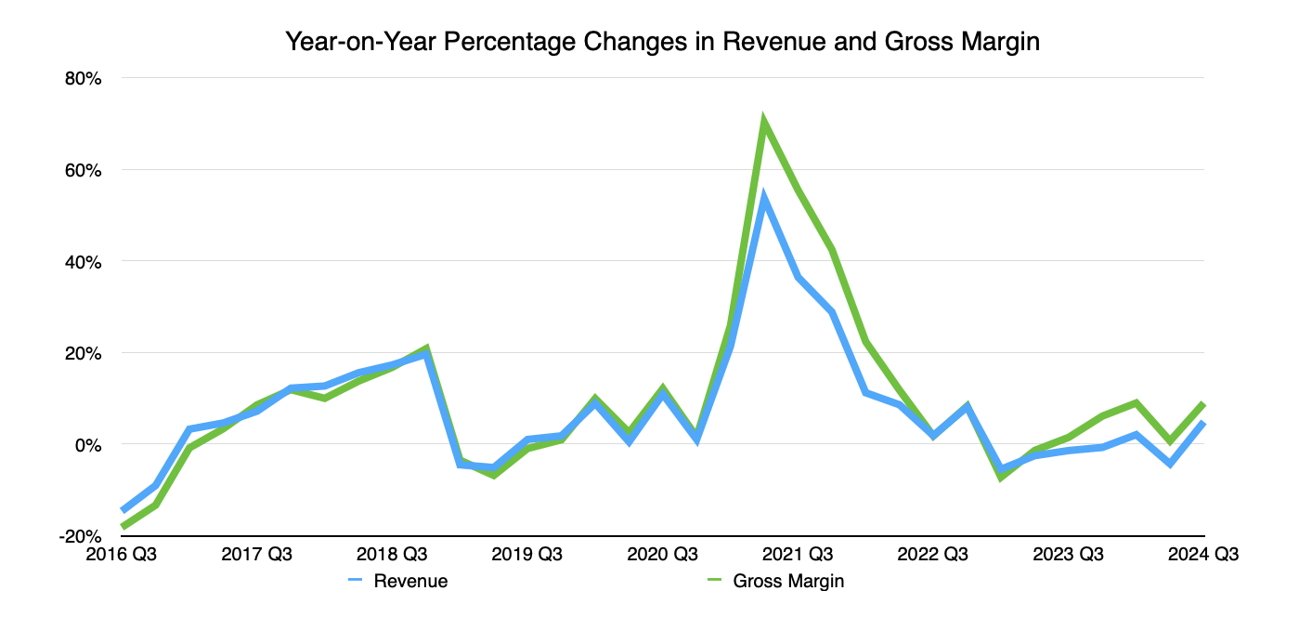
The headline number for Apple is its revenue, which hit $85.78 billion for the quarter. This is up from the $81.8 billion reported one year prior, representing a rise of 4.9%.
The net profit is also up to $21.4 billion, which is a rise of 7.9% over Q3 2023's numbers.
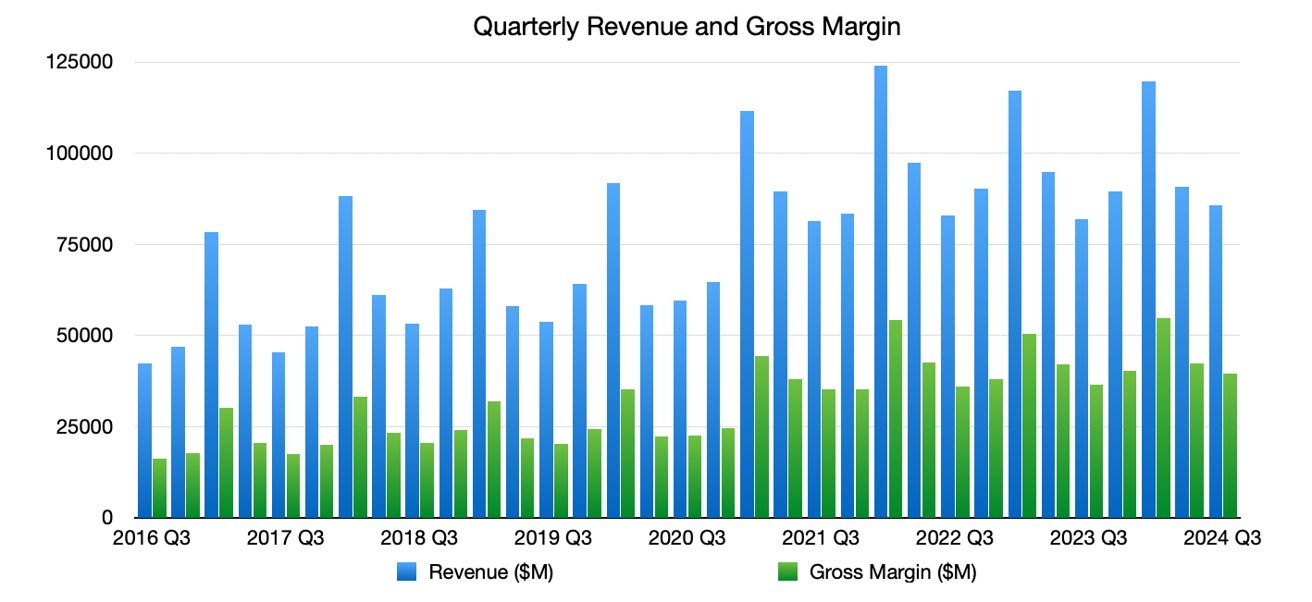
The gross margin of $39.7 billion is a sound 9% higher than the figure from Q3 2023.
At 46.26, the gross margin is a higher percentage of revenue than the 44.52% seen one year prior. It has been above 40% since Q2 2021.
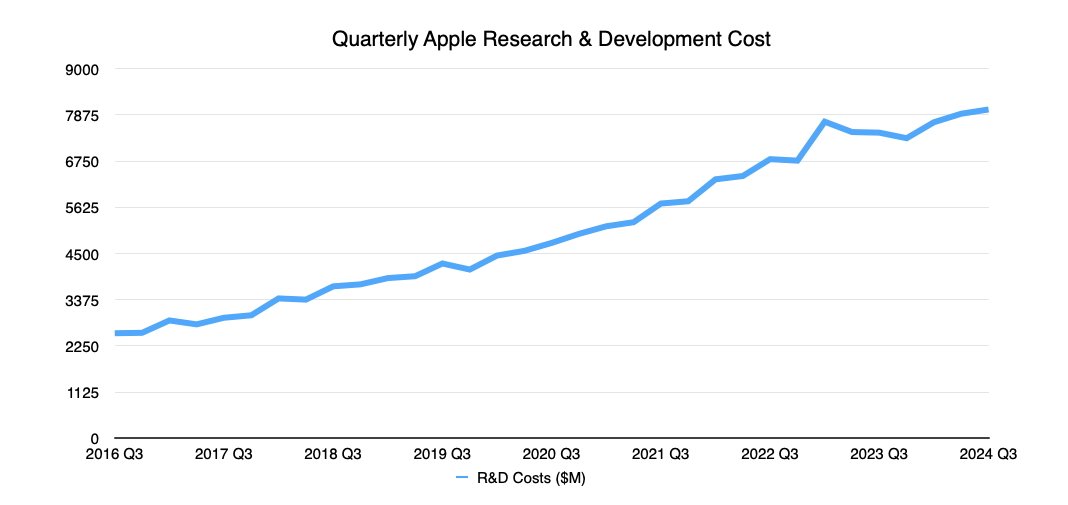
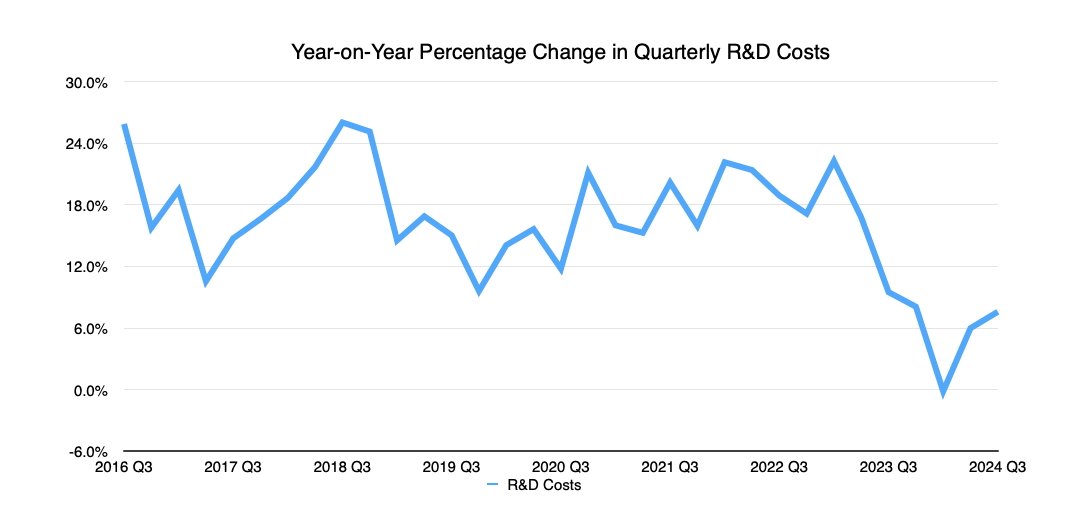
Apple's research and development spending is a phenomenally high value for any company, and it doesn't seem that Apple will be changing its habits anytime soon.
For Q3 2024, Apple spent over $8 billion on R&D. This value has gone up 7.6% since the same quarter in 2023, indicating an increase in spending for the period.
Apple's per-unit revenue and earnings
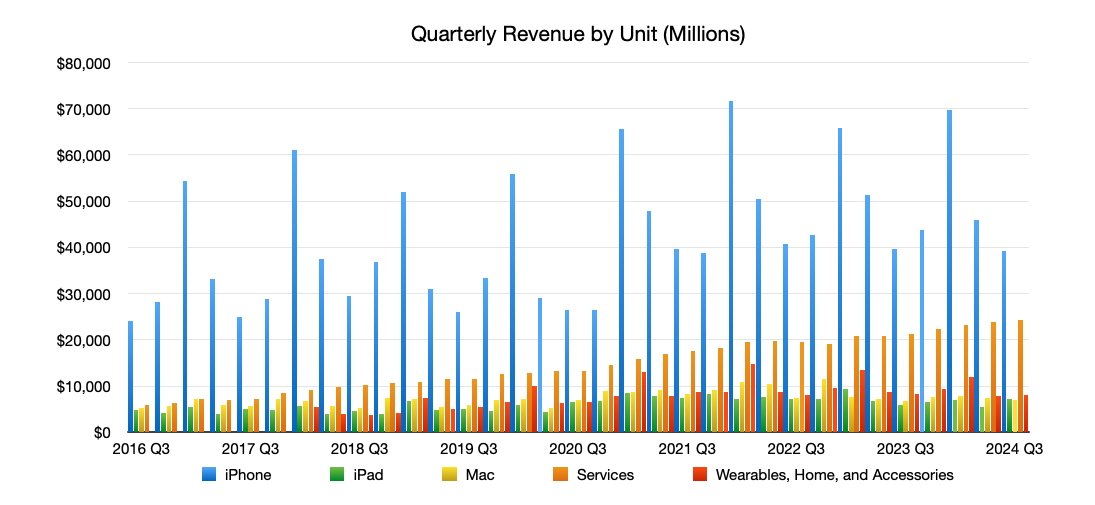
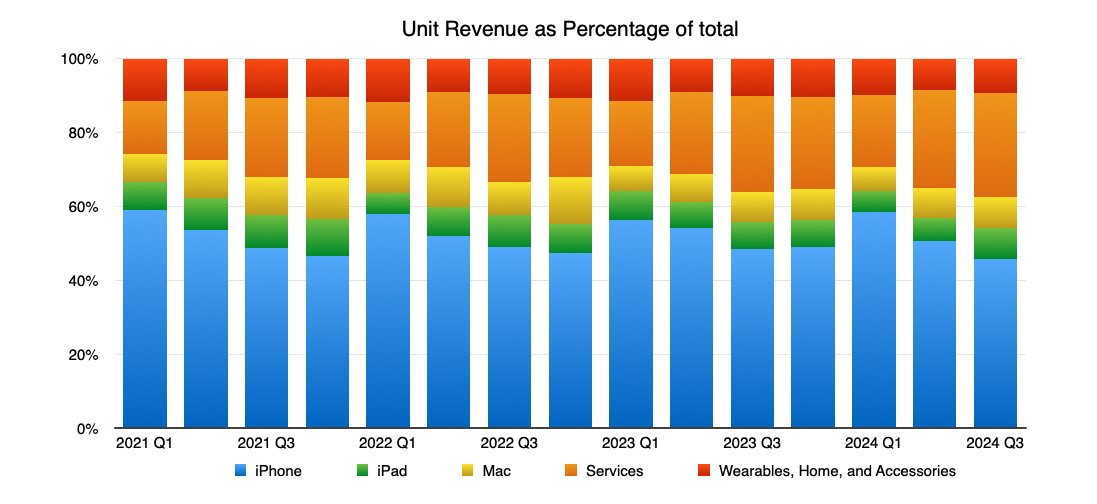
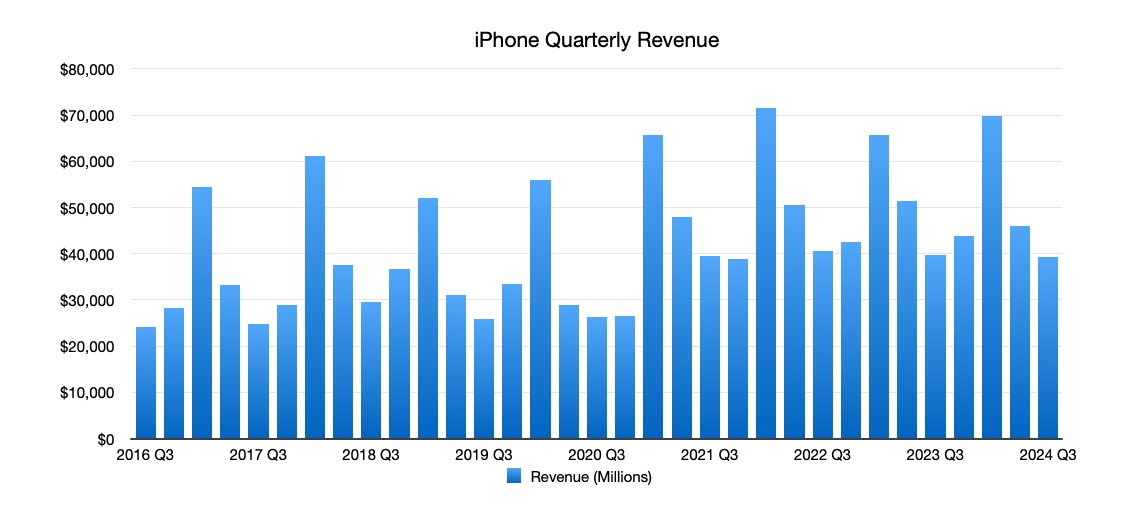
These first two graphs show Apple's individual unit revenue, to more directly compare them against each other.
This first one showing the revenue directly also shows that iPhone has been the main revenue generator for Apple over many years. However, that dominance is slowly starting to dissipate.
When looked at by how much revenue each unit brings in, we can see that the blue iPhone section is still major. Also, that orange Services element is gradually becoming a juggernaut in its own right.
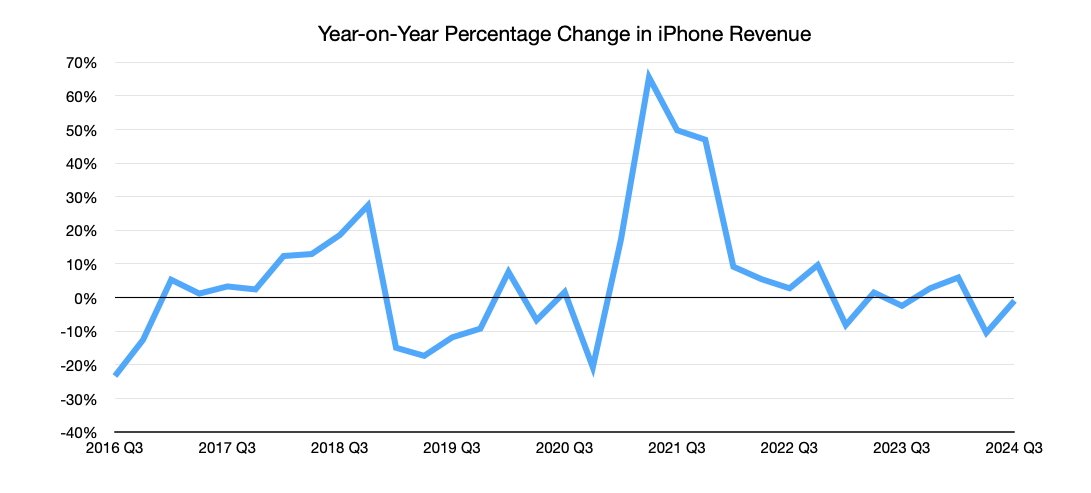
Revenue from iPhone was marginally down from Q3 2023, going from $39.67 then to $39.3 billion now. Even so, that's still better than the $38.81 Wall Street forecasted.
On a percentage basis, that's a negligible 0.9% year-on-year shrink in iPhone revenue. Given Q3 is the seasonally quietest quarter, it's not something Apple will really worry about too much.
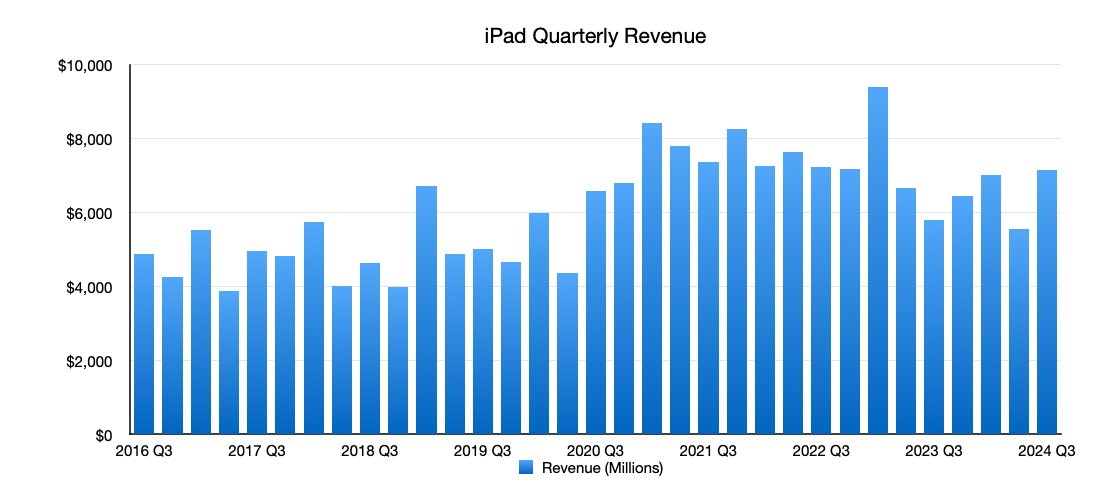
iPad revenue has enjoyed a rebound, going from $5.79 billion in Q3 2023 to $7.16 billion. That 23.7% year-on-year increase soundly beat Wall Street's forecast of $6.61 billion.
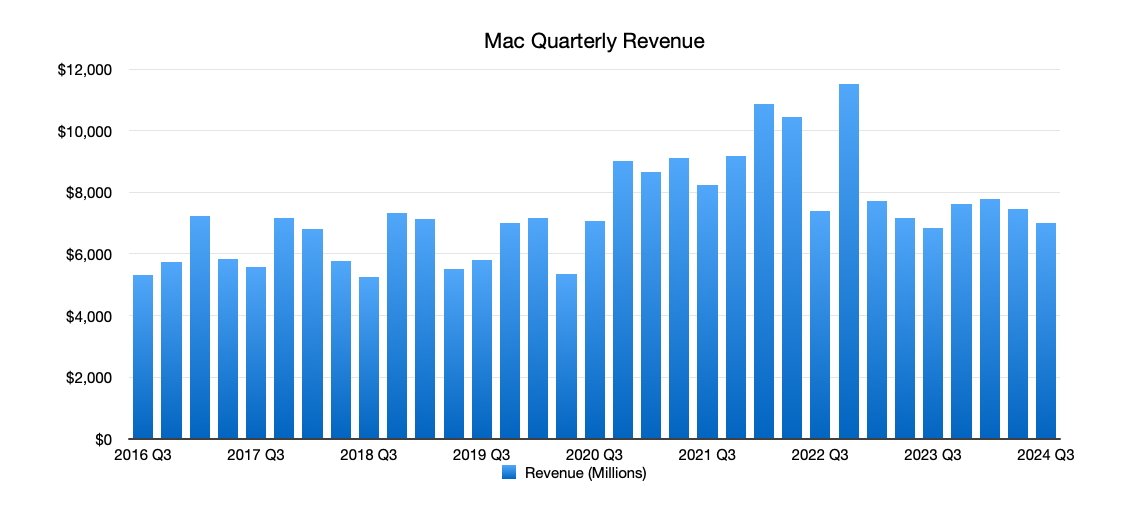
Mac also saw an improvement from $6.84 billion in the year-ago quarter to $7.01 billion now. That's a 2.5% increase, which isn't much, but still marginally under Wall Street's prediction of $7.02 billion.
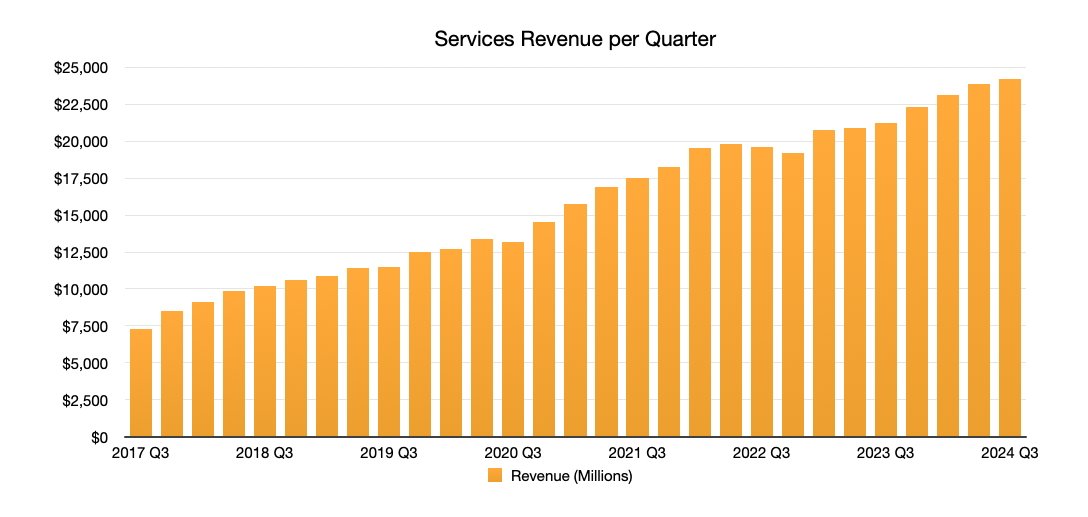
The ever-reliable Services business continued to turn its flywheel, growing from $21.21 billion in Q3 2023 to $24.2 billion. That represents a 14.1% year-on-year increase, and also another beat of Wall Street's $24.01 billion guess.
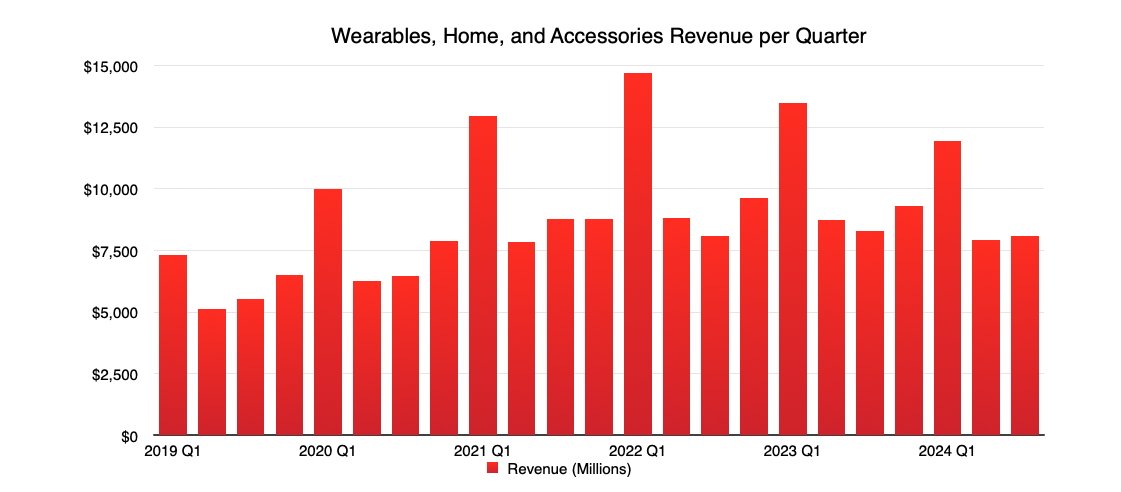
Wearables, Home, and Accessories, covering multiple product categories, saw a small dip from $8.28 billion last year to $8.09 billion this quarter. That works out to be a 2.3% drop.
Apple's operating segment revenue
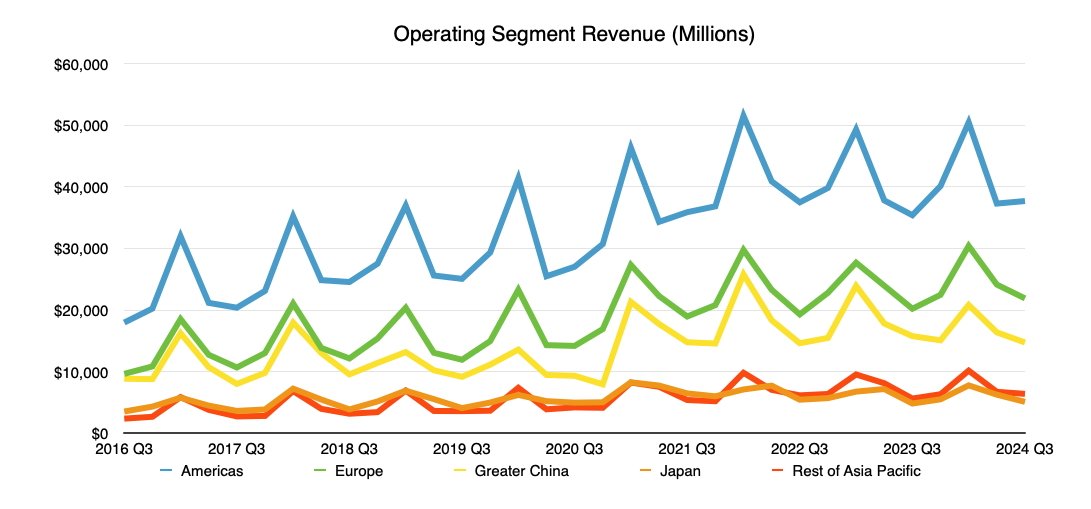
On a regional basis, The Americas brings in the most revenue at $37.6 billion, a 6.5% year-on-year rise. Europe's $21.9 billion is an 8.3% gain.
Japan managed $5.09 billion, a 5.7% year-on-year increase, while Rest of Asia Pacific hauled in $6.4 billion, up 13.5%.
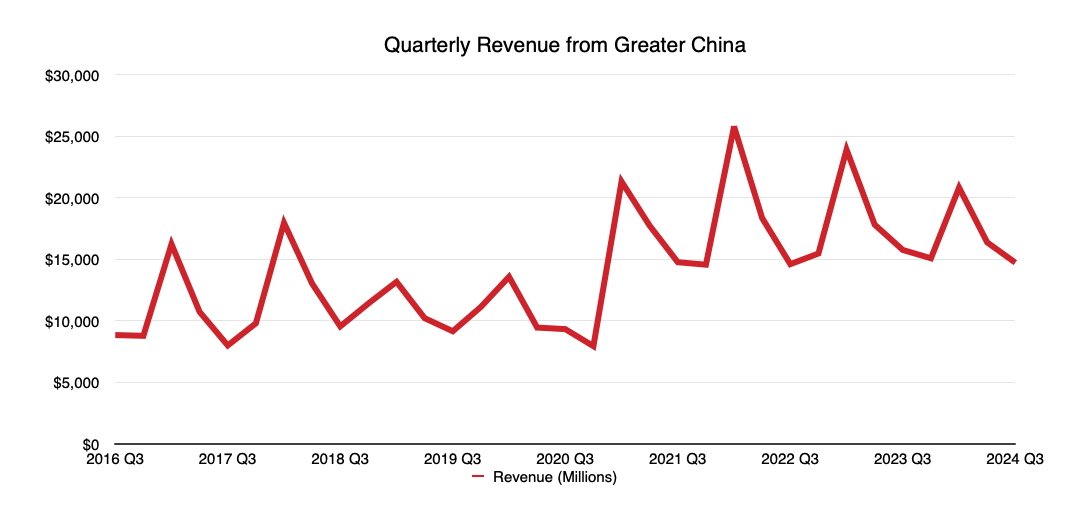
China is the outlier of the group, being the only one to see a year-on-year shrink in revenue. While Apple managed $15.75 billion in the year-ago quarter, China's revenue has dipped down to $14.7 billion, down 6.5%.
What the analysts say
As you'd expect, the opinions on the earnings are all over the place. Most are bullish, with still some concern about iPhone sales.
TD Cowen
The results were "broadly in line" for TD Cowen, but the December quarter "could be the early read on AI-driven upgrades leading to a strong iPhone cycle in CY25." It views "broadly stable iPhone and wearables trends coupled with iPad and Mac growth as encouraging"
"Despite the macro and China weakness, demand for iPhone and other hardware products remains stable," the note concludes. "Services momentum is a positive and underpins FCF growth. Next iPhone launch event in Sep could be a catalyst."
TD Cowen's price target for Apple is $250.
Piper Sandler
Piper Sandler says Apple's results were ahead of expectations "largely on the back of strong growth in iPad and services." China's revenue "showed further signs of improvement" for the iPhone maker.
While noting management as being "very excited" about Apple Intelligence, the analysts are concerned about it rolling out in stages globally, and it is also "cautious about the consumer entering the second half."
It reiterates a Neutral rating and a $225 price target.
Gene Miunster
Gene Munster of Deepwater calls it a "solid quarter" for Apple in a YouTube video, one which insists investors are keen to know how AI will impact the next quarter. To Munster, iPhone, iPad, and Mac will be "accelerating revenue growth."
In theory, Munster believes this will be around 5% growth for the units in Q4, rising to 6% and 7% over time, and possibly to 8% in the middle of the 2025 fiscal year. Apple's guidance for the next quarter was "effectively in line" with Wall Street expectations, but Munster cautions it's in the face of a "stronger than typical Osborne effect."
While Munster muses that Apple's guidance usually softens before a major release, Apple didn't do that this time around. The analyst believes this speaks to Apple thinking the iPhone is a necessity and a sign of the strength of the product line.
J.P.Morgan
In J.P.Morgan's review of the results, it discusses how Apple's results and execution "stood out in its non-eventful nature" with most product categories beating consensus expectations. This "is exactly what is desired as we look forward to the AI upgrade cycle."
With Apple planning a roll-out of Apple Intelligence to English-speaking regions first then a wider release, J.P.Morgan warns it "would continue to monitor for timing of the releases, which has the potential of shifting the timing of the volume upgrade." Namely, it thinks the higher levels of upgrade will occur when Apple Intelligence is available in more regions.
"In some sense, the magnitude of AI-led opportunity will likely be broader for Apple even relative to the 5G cycle given that the upgrade cycle opportunity extends across all devices."
J.P.Morgan has a price target of $265.
Morgan Stanley
Morgan Stanley's view is that the results will "do little to shift the investor narrative" of an "Apple Intelligence-driven, multi-year product refresh cycle thesis." The results "largely played out as expected."
There aren't many catalysts on the horizon until the iPhone 16 launch and the rollout of iOS 18 with Apple Intelligence, followed by pre-order and sell-through data in early October. But even so, Morgan Stanley feels institutional managers still view Apple as "underweight" leading to a belief Apple will "continue to outperform."
Morgan Stanley has a price target for Apple of $273.
 Malcolm Owen




-m.jpg)




 Andrew Orr


 William Gallagher


 Wesley Hilliard


-m.jpg)


10 Comments
It’s funny to me that everyone missed the fact that services are now equivalent to Mac, iPad and Wearables in terms of revenue for the quarter. That is an accomplishment that the Apple analyst naysayers don’t comment on.
I do not get this focus on revenue in the article when discussing Apple results and growth in Services. It is the relative gross profit contribution story that matters.
Services keeps on increasing its relative gross profit contribution vs Products. This quarter it is up to 45% vs 41% q3 2023.
What most analysts seem to miss is that having near flat iPhone sales is A-ok for Apple given that a significant chunk of sales are for people new to iPhone/Apple and the installed base keeps growing driving services revenue that is now at 74% gross margin. Quite nuts margin given the likely focused investment into Apple Intelligence and content for ATV+.
Thought experiment to drive home that Apple has been for a few years and is now even more so a services business.. If Services had the same gross margin as Products for the gross profit of Services it would equate to a 50 Billion quarter for Services sales dwarfing out iPhone revenue at 39B. (Calculation and list is flawed since the individual products have different gross margins).
* Services (recalculated): $50,686 million
If Services did not grow this quarter then net income would be down YoY as broader costs grew and the marginal increase in gross margin from products would not have covered it.
Projecting the trends of 2021 - 2024 into the next 3 years then Services will exceed Products relative gross profit contribution in a Q3 with only the holiday quarter making a meaningful dent in that relationship in favour of Products.
Looking at the Services business it is a cash printing machine with costs growing much slower than revenue and over time this may grow Apple's confidence in realigning their shareholder capital returns strategy more towards dividends. Personally I think the share buyback does not seem to be as effective as advertised given the intense speculation in Apple stock.
The dividend payout headroom is substantial that seems to be ranging from 10% - 18% in a quarter with mature companies being in the 30-50% range. Here is hoping that Apple increases this dramatically over time.
Gotta love Apple’s commitment to R&D.