What a difference a week makes: Apple's $88.3 billion quarter is even more impressive broken down week-by-week
Not only was Apple's holiday quarter of 2017 a hard compare to previous year's numbers because of three flagship models, but the year-ago quarter had an extra sales week. AppleInsider breaks down the numbers for a closer look at Apple's earnings, on a "average per week" basis.
Apple's first fiscal quarter of 2018 was a blockbuster. Apple broke its revenue record it posted a year ago, and posted revenue of $88.3 billion dollars. The results were built on the foundation of 77.3 million iPhones sold in the quarter — led by the iPhone X.
The only thing that it may have disappointed on was that 77.3 million iPhone sales volume, but it more than made up for that in an average selling price of $796.42 per unit, as well as a dramatic increase in services and the catch-all "other" category."
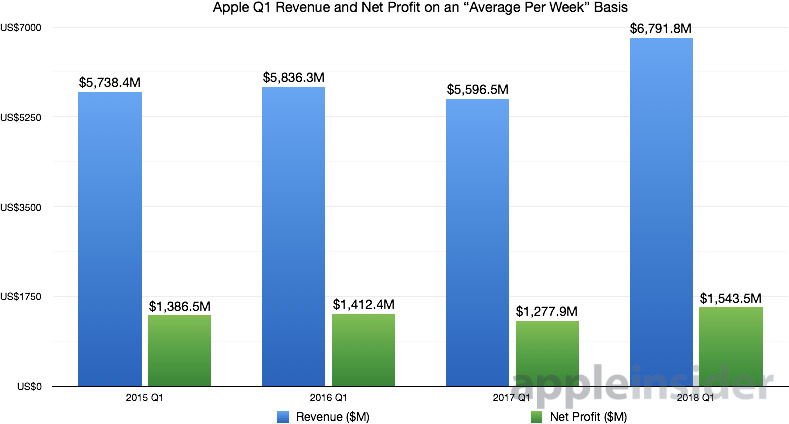
But, a lot of time was given in the question and answer session following the earnings report both last year, and this year, to the fact that not all quarters are the same, from a sales week perspective. There are two ways to look at this mathematical oddity — the first is comparing quarter to quarter on an average sales dollar per week basis. The graph below illustrates the tale, but in the 14-week quarter a year ago, Apple generated $5.60 billion in revenue per week, with it topping $6.79 billion a week in the most recent holiday quarter.
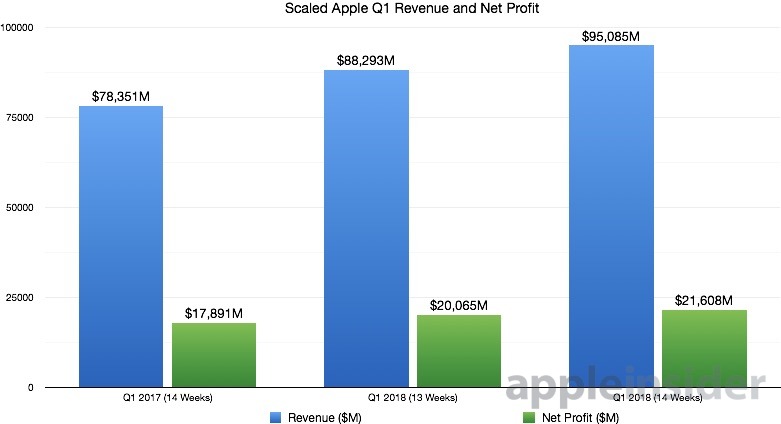
The other way to examine the data is projecting if the holiday quarter was a 14-week one, what would Apple have made given the same volume of sales and earnings.
Lies, damn lies, and statistics
In the U.S., companies report on a quarterly basis, so we periodically get a quarter that's one week longer than the previous one, with the resultant mathematical oddities and bad compares. That reporting period is monthly in some others — it's all for consistency, and it all comes out "in the wash," so to speak. But, that one week can make for some difficult comparisons, from time to time.
As far as the future goes, Apple's predictions for the next quarter are (obviously) lower than the holiday quarter. It's the nature of the holiday season, and an iPhone release purchase cycle four full months prior at the start of the quarter.
But, even those numbers are ridiculously higher than last year's, by a full $9 billion. Apple is predicting to make between $60 billion and $62 billion in the now-current quarter, with the year-ago quarter having actually hit $52.9 billion.
If nothing else, coupling with what Apple is predicting for this quarter, combined with looking at the holiday's sales data on a quarterly or weekly basis just takes a different angle of approach to what Apple has said all along — that there is no wavering in the strength of the iPhone X because of a hypothetical weak demand, as poorly predicted by Nikkei and other prognosticators.
 Mike Wuerthele and Malcolm Owen


 Malcolm Owen
 Charles Martin

 Mike Wuerthele


 Chip Loder

 William Gallagher





30 Comments
Great job Mike/Malcolm...much appreciated
Thanks for hitting home just how nonsensical investors' reactions have been to this amazing news! Their only complaint is that Apple didn't hit their own expectations, but seeing how dramatically their view on Apple swings, they clearly know little about the business and should be ignored.
Weird how October+November+December 2017 (31+30+31 days) is somehow a week less than those same three months of 2016.
(Presumably it's because they "close the books" on sales at the end of every week rather than daily, but still.)
damn, why can't Apple just do calendar quarter? Is there any tech reason?