Apple hit yet another record for the September quarter results with $64 billion in revenue. Here's how that compares to previous quarters, earlier years, and how much money some countries and US states generate.
Revenue
"We concluded a groundbreaking fiscal 2019 with our highest Q4 revenue ever, fueled by accelerating growth from Services, Wearables and iPad," said Apple CEO Tim Cook on Wednesday. In reality, revenue is a little higher overall, but the net profit earned is still a little down year-on-year, to the tune of 3.1 percent.
For reference, Apple's $64 billion for the quarter is higher than the GDP of Tanzania, the 74th largest in the world based on 2019 IMF estimates, and is the equivalent combined GDP of the bottom 34 countries. The quarter's revenue would also put Apple 4th on Forbes' Billionaires list, between Bernard Arnault ($76 billion) and Carlos Slim Helu ($64 billion).


Gross Margin
The gross margin continues to be quite stable for the company, with a marginal change upwards in terms of percentage of gross revenue. If Apple continues its shift towards being a more Services-oriented company, the more lucrative and higher-margin Services will outweigh the lower margins of hardware and push the percentage further up.


Research and Development
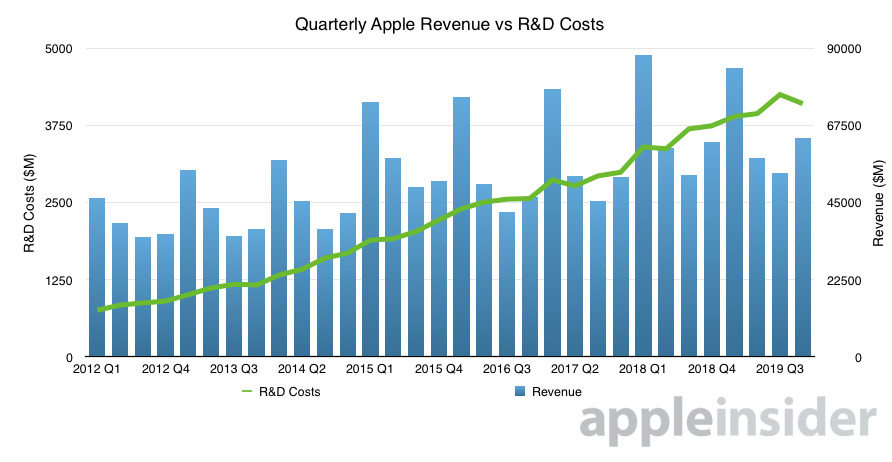
While the cost of research and development has risen over the years, it's done so at a fairly consistent and steady rate. Though this may seem alarming given it isn't linked to revenue, Apple is still extremely efficient when it comes to R&D compared to its competitors.
Apple's R&D spend for the quarter is greater than the GDP of Sierra Leone ($3.998 billion).
Product Categories
It is no surprise that the lion's share of Apple's revenue stems from iPhone, but the growing bars of the other elements of Apple's empire is an encouraging sight, showing a diversification of its income streams. For year-on-year growth, while iPhone is down the most, with Mac dipping below 0%, iPad, Services, and Wearables, Home, and Accessories continue to see improvements.


iPhone
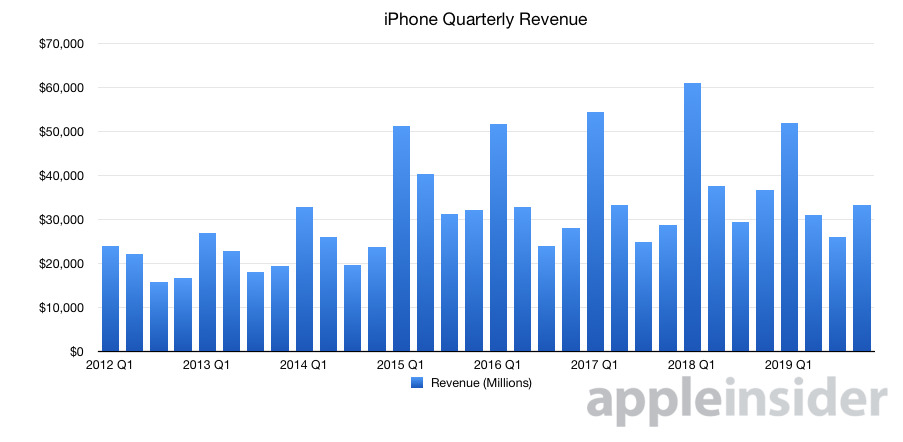
Apple revealed during the investor call the active install base of iPhone is at an all-time high in each geographical segment, with 83% of business buyers also intending to buy iPhones in the future. In the graphs, the growth in 2017 and 2018 has yet to be reattained, but the lower shrinkage in revenue is a good sign for iPhone sales, though Apple's policy of not revealing unit sales doesn't help in advising if it is from a higher average selling price or from shifting more units.
Apple's iPhone revenue for the quarter is the equivalent of the GDP of the bottom 26 countries in the world combined, and on a single country basis, is higher than the GDP of the Sudan ($31.4 billion).


iPad
The active install base for iPad is at an all-time high as well, with more than half new to iPad. There was a 17% growth in iPad Pro, showing an ongoing momentum of the range, while iPad revenue in total grew to $4.66 billion.
Mac
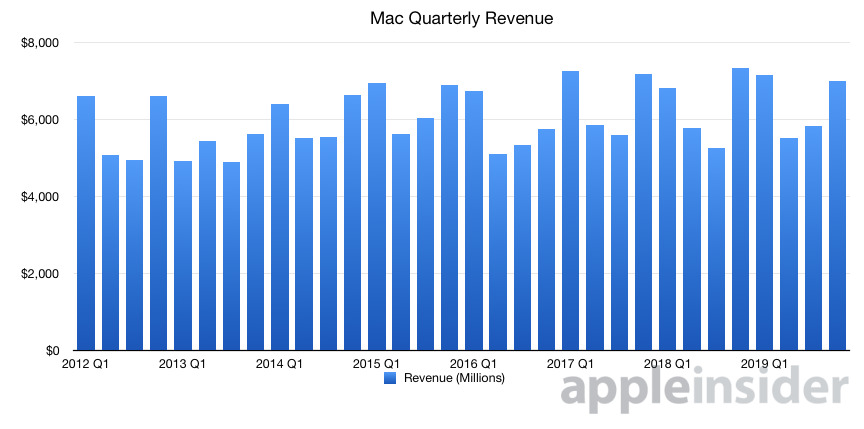
Again, an all-time high active install base was claimed for Mac, which earned $6.99 billion for the company, though this is a dip of 4.8% year-on-year. Apple said it was a "tough compare" to last year due to the release cycle, but still Mac generated its highest annual revenue over an entire fiscal year.
The MacBook Air was the best product over the quarter, with more than half of Mac purchasers new to the Mac.
Services
Services revenue brought in $12.5 billion, and with a gross margin of 61.4%, is also a highly profitable area for the company, with the arm being a 20% segment of the revenue mix, and 33% of the gross margin mix.
Double-digit growth of paid Services accounts in every market in the quarter, 450M accounts, versus 330M year-ago-quarter.
For context, Services' quarterly revenue is higher than the state spend of Rhode Island ($10.0 billion), or New Hampshire and Vermont combined ($6 billion each).


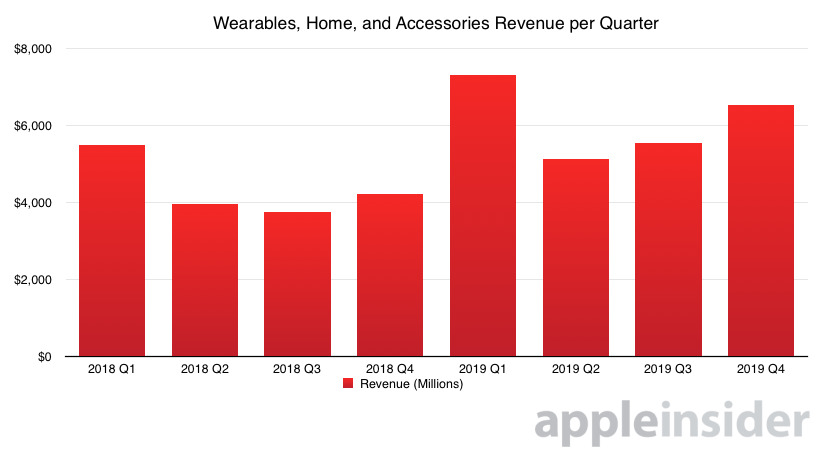
Wearables, Home, and Accessories
Wearables revenue produced Q4 records in every tracked market, with the segment earning $6.52 billion in the quarter and massive growth over last year's figures. AirPods, Beats, and Apple Watch are said to be the main growth areas for the arm.
The Wearables, Home, and Accessories category earned Apple in the quarter than the GDP of the Maldives ($5.7 billion).
Operating Segments
The Americas continue to be the most important region to Apple in terms of revenue, followed by Europe then Greater China. While there is little change in most regions, the Americas is seeing more growth than others, and could see even more in the next quarter's results.


China
A sensitive but important region for Apple, the revenue in Greater China is only slightly down year-on-year, following after multiple quarters of year-on-year shrinkage. This could be a sign Apple is becoming more stable in the market, and could enjoy more growth later on.
Cook noted a greater improvement in revenue trends in Greater China, with good reception for the iPhone 11 family but a "combination of things" helped with the turnaround.


Annual Results
As it is the fourth quarter, we now have the full-year results, which can be compared against previous years without having to look at the seasonality of quarters.
For the full year, the gross revenue is slightly down from 2018's figure, but it is still quite commendable, especially when looked in context to the last decade of results. While the year-on-year change isn't as massive as it once was, like in the early stages of the iPhone's lifespan, the sheer revenue earned puts Apple in quite a comfortable position.
Continuing the richness comparisons, Apple's full-year revenue of $260.174 billion puts it higher than the GDP of the Czech Republic ($246.9 billion), the 45th highest in the world, as well as equalling the bottom 56 countries of the GDP list combined. It is bigger than California's state budget of $214.8 billion, and is over 12 times the 2019 budget for NASA ($21.5 billion).
For the last five years of product category revenue, iPhone is obviously still a major factor, but the chart does highlight the resilience of the Mac market, the growth rate of Services, and that the Wearables, Home, and Accessories business is a useful element that could enjoy Services-level success down the line.