Crash reports can lead to clues as to why an app crashed in macOS. Here's how to understand what those reports actually say about your Mac.
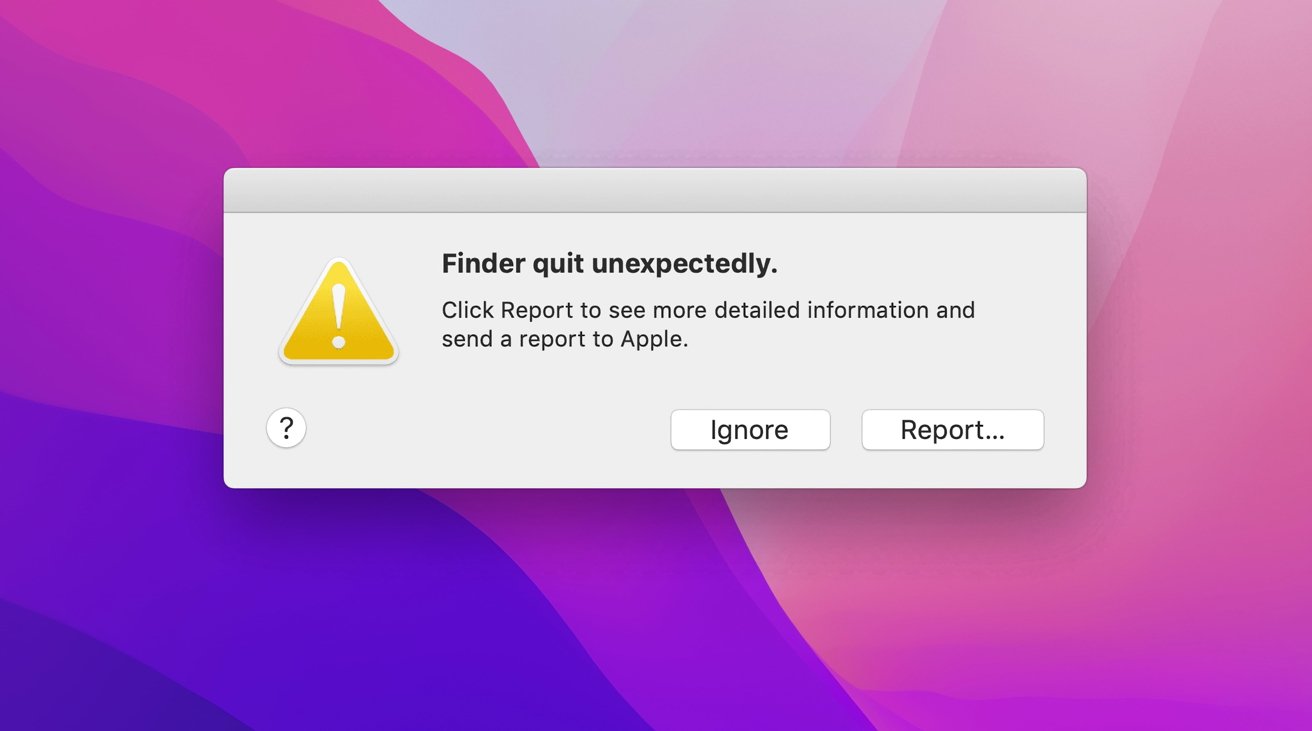
You've probably seen a Finder alert when an app quits unexpectedly on your Mac.
Known in the programming world as a "crash," these errors usually happen when a bad piece of code gets to run that the system or CPU can't execute. They can also happen if an app tries to access a missing or outdated version of a library or framework and can't execute a needed piece of code.
When macOS displays one of these crash alerts, you can either click the "Ignore" button, or you can click the "Report" button.
If you click the "Report" button, Finder displays a window with the crash report, and a "Send to Apple" button. You should send the report to Apple if it was Apple software that caused the error.
Each crash report is stored in an .ips file in the folder "DiagnosticReports" inside your user folder at /Users/~/Library/Logs/
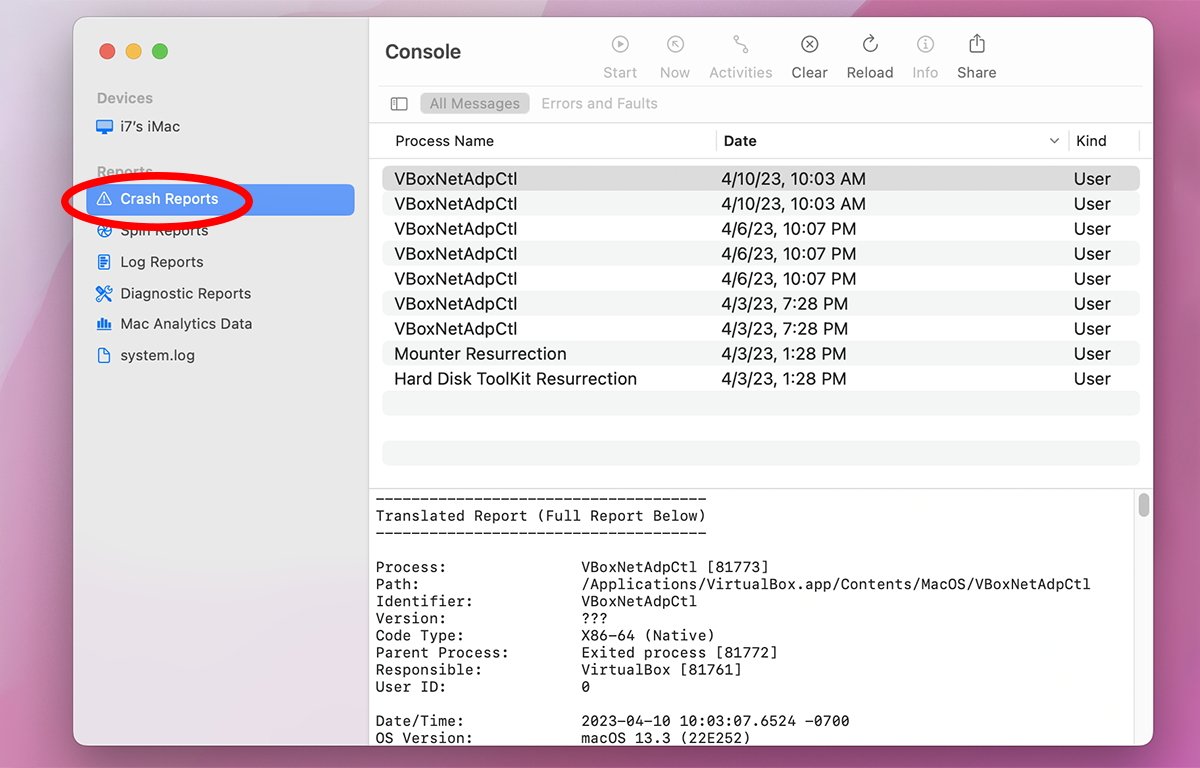
You can also view and open these reports in Apple's Console app by selecting the "Crash Reports" item on the left-hand side of the Console window, selecting a report in the right-side of the window, and then Control-clicking or right-clicking the report and selecting "Reveal in Finder" from the popup menu.
This opens the DiagnosticReports folder in Finder, revealing all saved crash report files. These reports are only kept by macOS for a limited amount of time, and then it automatically starts deleting the oldest reports first.
There's also a "Move to Trash" menu item in the Console popup menu if you want to move the selected crash report files to the Trash.
If you double-click an .ips file in Finder it merely re-opens it in the Console app. If you Control-click an .ips file in Finder and select "Open With", then "TextEdit" from the popup menu, you can also open the .ips file in TextEdit.
Be aware the text of each report stored in an .ips file is in JSON format, so you'll need to be able to read JSON to understand it.
Reading crash reports in Console
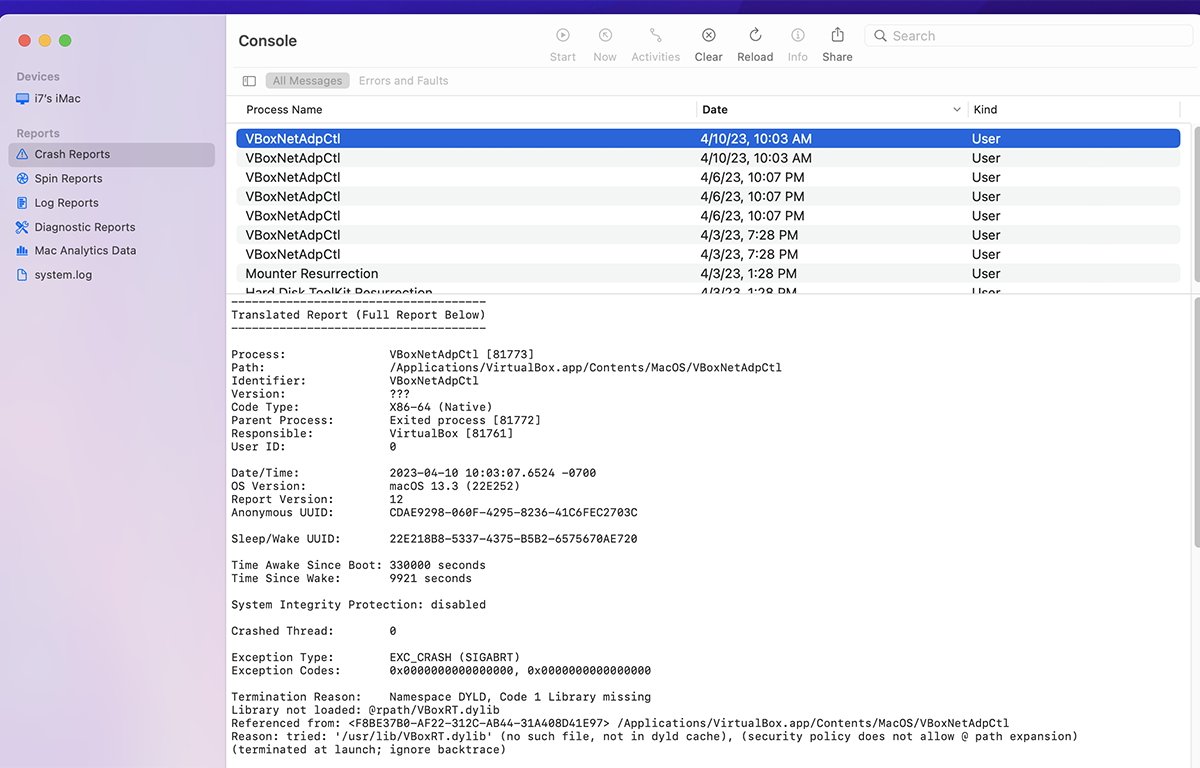
At any rate, if you select a crash report in Console, you can read its text in the main text pane below it:
Let's take a look at the first few fields in a crash report. "Process" in UNIX means a running app. The fields are:
- Process - the app or process name.
- Path - where the app binary lives on disk.
- Identifier - usually the binary or bundle name, but not always.
- Version - the binary version or ??? if unknown.
- Code Type - Intel or Apple Silicon. "Universal" if both.
- Parent Process - the binary or app that launched this process.
- User ID - the UNIX id or PID of the process - the same process ID as shown in Terminal.
Next, we have the date/time, the OS version, report version, and a unique UUID for this report. There is also a unique sleep/wake ID.
The report also lists whether System Integrity Protection is enabled or not.
Next, the report lists details about the crash itself. This info can be quite technical and is generally intended for programmers or for Apple in order to trace where the problem occurred in application code so it can be fixed.
Usually, the thread number that crashed will be listed - in this case the first thread - thread 0. Think of a thread as a path of code running independently of other code. On multi-core CPU systems, each core can have one or more threads running with all cores running in parallel if needed. This is known as parallel computing.
Next, the crash or exception type is listed:
Exception Type: EXC_CRASH (SIGABRT)
In this case, SIGABRT - the UNIX signal to abort, or kill, the thread was sent. Signals are messages UNIX sends to running processes at a low level to tell them to do something - in this case, to quit.
More information about UNIX signals and how they work is available online.
Next are exceptions codes, if any, but these are often zero.
The "0x" before each code means the code value is in hexadecimal or "hex" instead of decimal. Hexadecimal is a base-16 number system - with sixteen values instead of ten like the decimal number system has. Hex uses 0-9 and then A-F as the additional values.
You can read up on how the hex number system works in any good book on the C programming language.
Next is the termination reason, which is usually an English-like description of what caused the crash. In this case "Namespace DYLD, Code 1 Library missing".
DYLD is the Dynamic Loader - the part of the OS that dynamically loads code into memory from disk when it needs to be run. You can read more about DYLD in Terminal by typing man dyld and pressing Return.
Namespaces are naming conventions used in some programming languages to isolate sections of code from other code. "Code 1 Library missing" means DYLD tried to load a dynamically-linked library but couldn't.
In programming, libraries are bundles of code. Libraries can either be static (linked into an app at build time), or dynamic (loaded into an app at runtime).
If the error is a DYLD load error, the next line tells us which library it was, and where it lives on disk:
"Library not loaded: @rpath/VBoxRT.dylib"
In this case VBoxRT.dylib is a dynamic library (.dylib) for Oracle's Virtual Box application. DYLD looked for the VBoxRT.dylib dynamic library but couldn't find it so the app couldn't run and was sent the SIGABRT signal to tell it to exit.
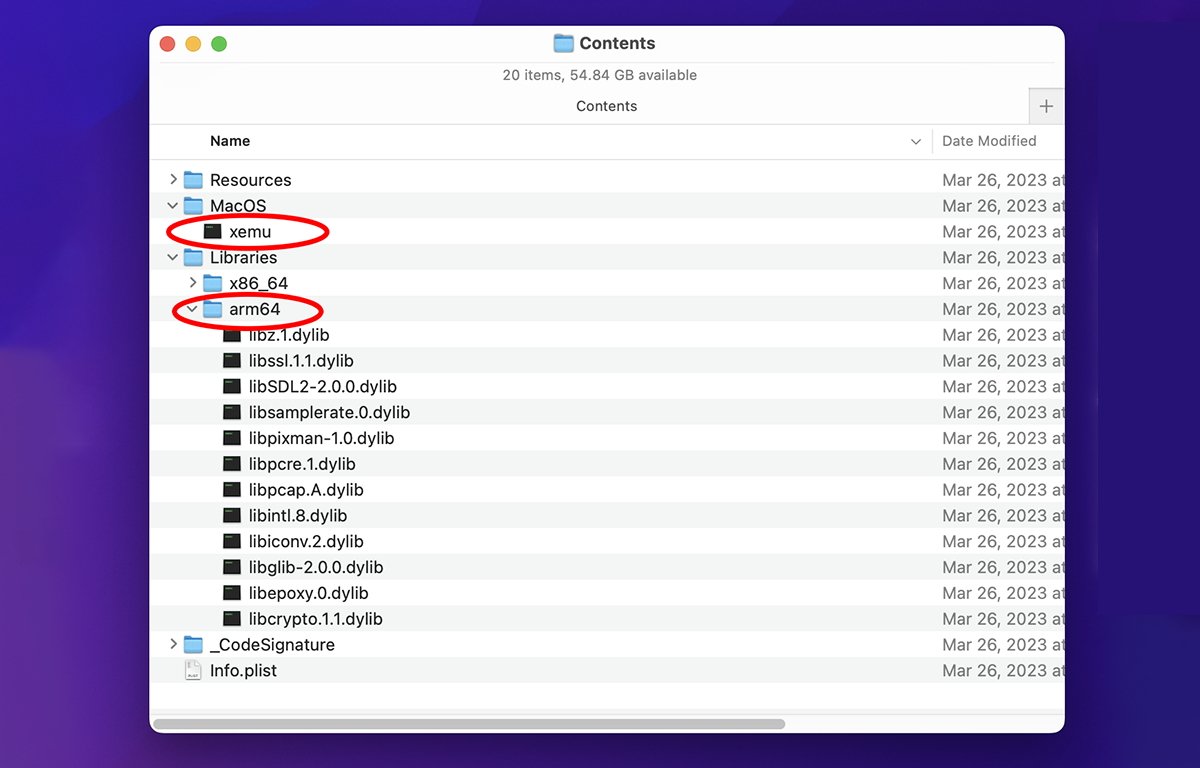
Apps for macOS and iOS are actually made up of several components - usually a folder called a Bundle
In this example, we can see the app binary inside the MacOS folder inside the Contents folder in the app bundle:
There is also a Libraries folder and then both Apple Silicon and Intel x86 libraries in folders in .dylib format for both Mac platform architectures. They get loaded at runtime as needed by DYLD.
Some app bundles can be quite simple, others very complex. Code and other resources can be stored elsewhere, outside app bundles.
In the above example, a .dylib is stored externally, and would normally be loaded when needed at runtime. .dylibs are usually single binaries instead of bundles.
There is also support in iOS and macOS for Frameworks, which are bundles containing code and other resources. You can peek inside of frameworks in Finder the same way you can look inside app bundles using the popup menu mentioned above. Frameworks always have a version number inside their bundles.
Frameworks can be stored inside app bundles, or in /Library/Frameworks, and /user/~/Library/Frameworks. Much of macOS and iOS themselves are implemented as dynamically loadable frameworks.
Apple has a developer Framework programming guide that describes in detail the loading and binding process for macOS and iOS code. Connecting two pieces of statically related code is called linking, rather than binding, and is done when an application is built with a compiler.
Static code all get loaded at once, which can consume more system memory.
Apple also has a separate developer document that details the Objective-C and Swift runtimes, both of which contain additional info about how code gets loaded during app execution.
Dynamic code loading goes all the way back to the late 1970s with languages such as SmallTalk. On Apple's platforms, it came about as a result of Apple buying NeXT in 1997 - and along with it, acquiring NeXT's programming language Objective-C which pioneered the use of dynamic linking and introspection.
Today, Apple software is still written in either Objective-C or Apple's own Swift, which also uses dynamic linking and loading.
Dynamic loading allows apps to have a smaller memory footprint since not all of an app's code and resources need to be loaded into memory at once. The downside of dynamic loading is it is sometimes slower, since resources have to be loaded from disk while an app is running.
This is one of the common reasons for the infamous macOS spinning beachball cursor.
Next in the crash report, we are told which calling process or code binary called the offending code, listed under "Referenced from:". In this case, it was the main VirtualBox application binary stored inside the app's bundle.
The final bit of English-readable info is "Reason:", which tries to provide a human-readable reason why the crash happened:
"'/usr/lib/VBoxRT.dylib' (no such file, not in dyld cache), (security policy does not allow @ path expansion)
(terminated at launch; ignore backtrace)".
This means the library needed should have been at /usr/lib/VBoxRT.dylib on disk but wasn't (it's usually put there by the VirtualBox installer at install time), DYLD hadn't previously loaded it, and the app was killed on launch.
So to summarize, in the above example, VirtualBox was launched but a required dynamic library that couldn't be found, so it was killed by macOS and it quit. All the info was collected and added to the crash report.
Additional Console info and stack traces
The rest of the info in the crash report is even more technical so we won't go into every detail here, but there are some things you can read quickly to determine what happened.
In particular, you can follow the app's code execution, in reverse order listed under each thread number, to look for clues as to why the crash happened. Not all crashes are related to missing libraries, so it's possible the app launched correctly but there was simply a programming error in the code that caused a crash.
Sometimes a programmer will make the mistake of calling system code that doesn't exist, or has changed its function parameters. Or it may be a memory access error, or overwriting variables in code with too much data which usually overwrites something adjacent in memory that was important.
All of these errors can cause a crash.
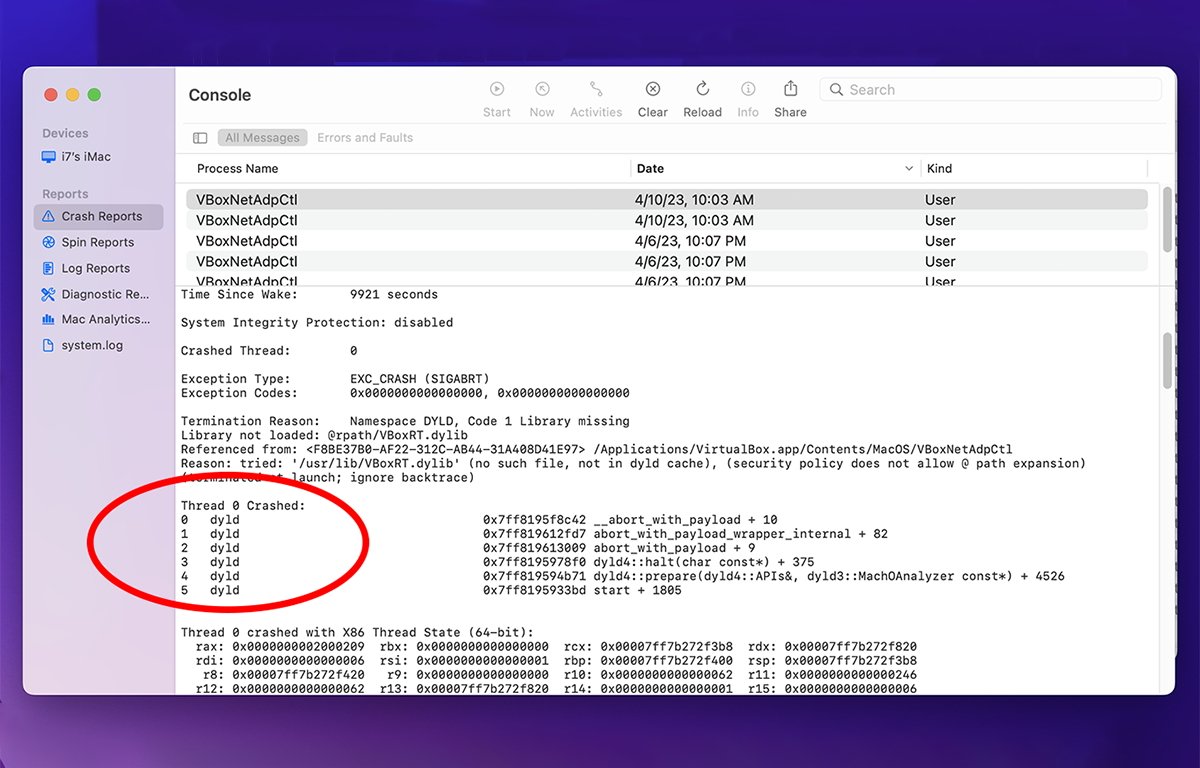
This info is normally listed immediately after the "Reason:" section, and usually has a list of numbered function calls, with their names, addresses in memory, and how they were loaded. Note that in this section, you want to read the list of functions (called the stack trace), in reverse order - from the bottom up.
This is the order the functions actually get executed in.
In this case, the stack is very short and consists mostly of DYLD preparation and halt/abort signals since the needed library couldn't be loaded on launch. But some errors can have quite complex stacks.
Usually, the last function at the top (end) of the stack is the one that caused the problem - but not always.
Knowing this can come in handy for diagnosing crashes since the stack can tell you the exact function call that failed. You can then look that function's name up in Apple's developer documentation to get more clues as to what happened.
Sometimes the framework or library name containing the crashing function will be listed in the stack trace, which provides even more info.
After the stack block in the crash report is some thread state info, which isn't really relevant unless you're a developer, followed by which CPU the thread was running on, an error code if any, and a Trap number. Traps are insertion points in OS code that get called when some event happens.
Crash memory and summaries
Next there is some info about binaries (compiled code) involved in the crash - and these are usually, but not always the same info as listed near the top of the crash report.
After that, there is an External Modification Summary - summaries of process IDs that interacted with this process, and some Virtual Memory (VM) info about which parts of code were in memory and which were still on disk. Virtual memory refers to disk space the OS uses as if it were real RAM in order to increase the total available memory used by the system.
Then there is some "region type" info which summarizes additional info about the stack, VM, link and text segments, and DYLD and shared memory. You can usually ignore this info unless you're a developer.
At the end of each crash report, there's a "Full Report" section, which is essentially a full raw JSON dump of the entire .ips file in text format. The raw JSON does contain some additional info not shown in the Console window - such as Apple Mac model ID, CPU type, code signing, and other info.
Also be aware that an app may have multiple threads running, so a similar summary like the one above will be listed for each thread. But usually, the crashed thread number is listed at the very top of the report so you know which thread number to look at.
All of this may seem overwhelming to the newcomer, but once you get the hang of reading crash reports, you can usually quickly and easily figure out what happened - and if you can do anything about it. In the above example, since a required library was missing, a simple reinstall of the app using its installer would be in order.
Apple does provide a detailed Console User Guide online, which is quite informative and helpful.
 Chip Loder




 Charles Martin
 Malcolm Owen
 William Gallagher
 Christine McKee
 Marko Zivkovic
 Mike Wuerthele

 Amber Neely

