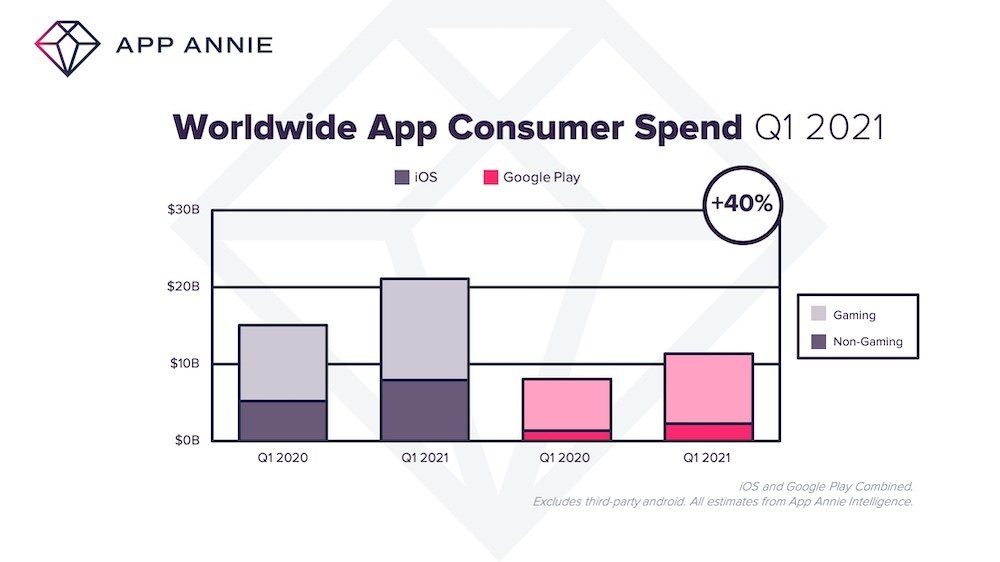
Consumers spent a total of $32 billion on apps across both the App Store and Google Play in the first quarter of 2021, up 40% from the year before.
App spending has surged during the coronavirus pandemic, with consumers spending an average $9 billion more on apps and games in Q1 2021 than they did in Q1 2020, according to new data from App Annie.
Growth between the App Store and Google Play was equal year-over-year, although Apple's app marketplace made more money. Consumer spending reached $21 billion on iOS and around $11 billion on Android. Combined, Q1 2021 marked the biggest quarter for app stores since App Annie started keeping track.
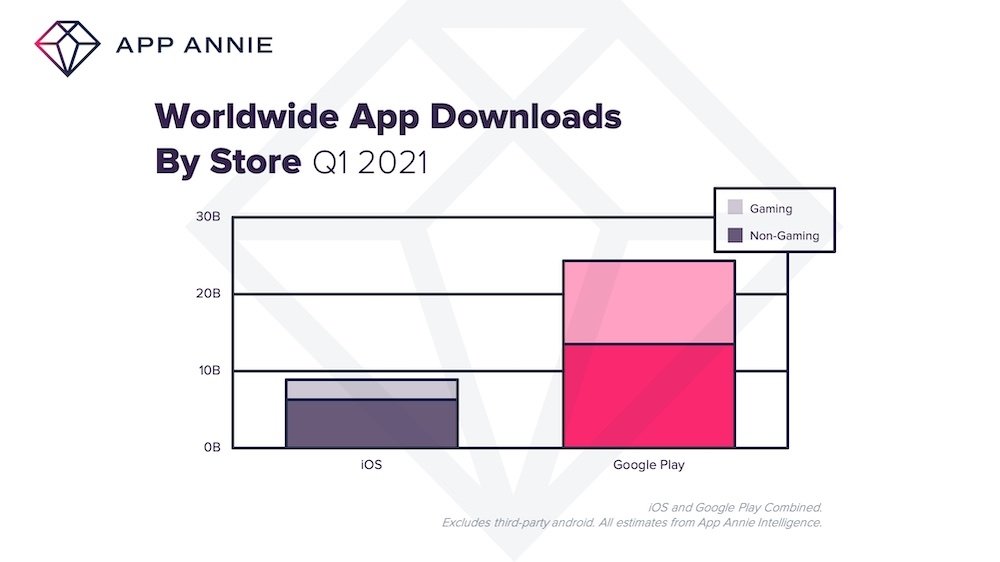
Total downloads were also up in the first quarter of 2021 compared to the year-ago quarter. App Annie notes that downloads on both iOS and Android rose by about 10% to 31 billion in the first quarter of 2021.
The top beneficiaries in terms of app categories differed by platform. On Google Play, the top-performing apps were Social, Tools, and Finance, while on iOS, it was Games, Finance, and Social Networking. Health and fitness apps also surged on iOS, with downloads rising 25% quarter-over-quarter.
As for as specific apps, TikTok, YouTube, and Facebook clocked the top spots in the non-gaming category based on downloads, consumer spend, and monthly active users.
Gaming apps again proved to be among the most influential category on both iOS and Android. Total consumer spending on gaming applications hit $22 billion in Q1 2021. On iOS, users spent $13 billion, up 30%. That's compared to $9 billion for Google Play, up 9%.
Gamers downloaded about a billion games every week in the first quarter of 2021, up 15% year-over-year and 3% up the weekly average in the first quarter of 2020. The most downloaded games in the quarter were "Join Clash 3D" in first place and "Among Us!" in second.
All in all, the pandemic accelerated mobile gaming during 2020. Game downloads outpaced non-gaming apps by 2.5 times throughout the pandemic-impacted year. And, in 2021, gaming is set to reach $120 billion in consumer spending, 1.5 times all other non-gaming apps combined.
 Mike Peterson


-xl-m.jpg)


-m.jpg)


 Wesley Hilliard
 Christine McKee
 Amber Neely

 William Gallagher
 Malcolm Owen

 Mike Wuerthele






4 Comments
And according to Epic Apple isn’t eligible for ANY of that revenue.
I hate how Google makes a portion on app revenue by selling knockoff iPhones with knockoff App Stores pre-installed, revenue stolen from Apple but love how they also get the lion’s share of stolen apps since scumbags are allowed to run free in the iKnockoff playground.
What's clear from these graphs is that Google Play ships more copies of apps that Apple's store, but it garners less revenue from apps than Apple's store. So if you have a business where support costs are proportional to the number of users, you are far better off just making an iOS app.
It's also interesting that non-game apps are such a high portion of the mix on Apple's store (roughly 3/4 by installs, as measured by the eyeball, versus just over half in Google Play) but the revenue mix gives the edge to games. I would dearly love to see some sort of measurement on revenue by apps that aren't geared towards addiction - I have a feeling that most of the games making serious money are fuelling addiction, but without numbers to back it up it's gotta remain a hunch. For those apps doing well while respecting there users, it would be great to find out what they're doing and why their customers are so willing to pay. Those lessons will drive the industry forward.