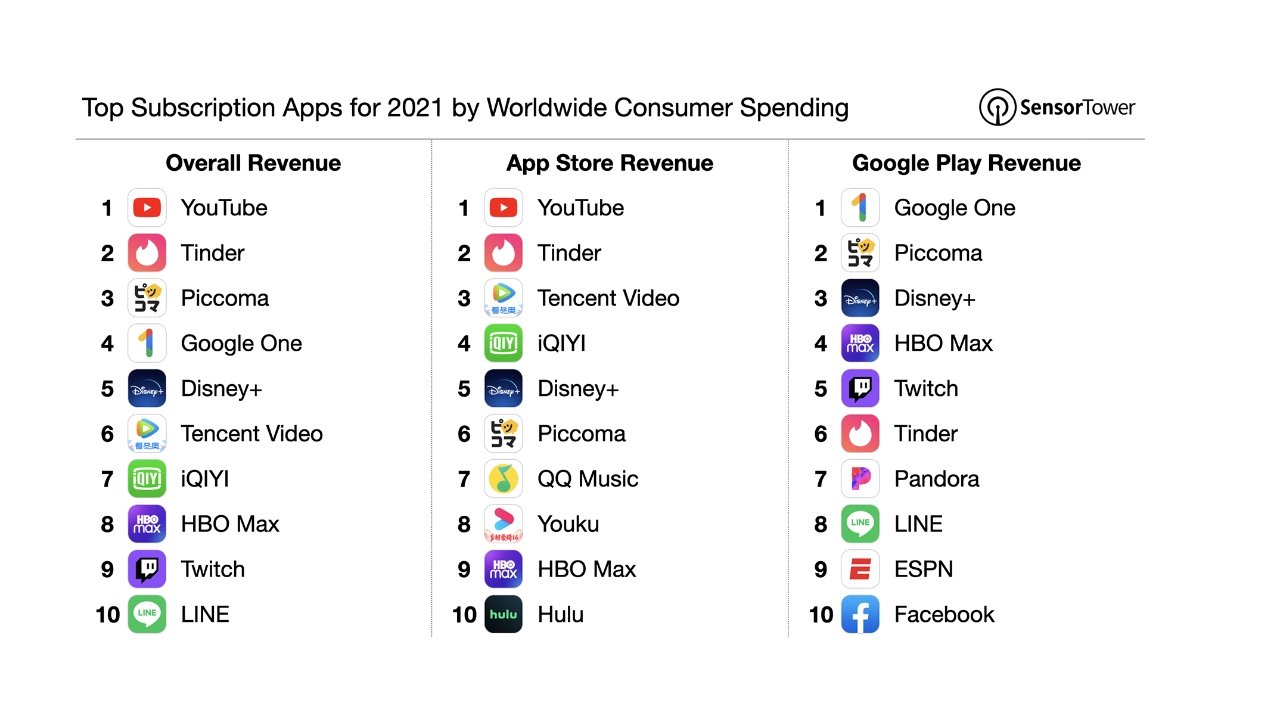
For 2021, the top 100 non-game App Store subscriptions generated $13.5 billion in revenue versus $4.8 billion in Google Play — although Google Play spending is growing faster.
Apple's App Store generally sees the most money spent on apps, subscriptions, and in-app purchases compared to Google and other competitors. Data from Sensor Tower backs this up yet again for 2021, with customer spending reaching a new record high of $13.5 billion spent on the top 100 non-gaming subscriptions globally.
According to the report, App Store subscription spending grew 31% year over year from $10.3 billion. Google Play saw over twice as much growth at 78% to $4.8 billion.
Despite this growth, Google Play spending is still less than half that of Apple's App Store. The numbers for US-only spending show similar results, with the App Store netting $6 billion versus Google Play's $2.5 billion.
Google apps saw the highest income across both platforms for YouTube and Google One subscriptions. YouTube generated $1.2 billion in worldwide revenue with Google One at $1.1 billion.
Apple boasts it has over 785 million paid subscriptions in the App Store. This includes non-Apple subscriptions like those made for apps and services.
Individual subscriptions are not broken out by Apple, so it isn't known how much customers spend on Apple Music, Apple TV+, or Apple's other services. Apple reports these revenues in a single category called "Services" during earnings calls.
 Wesley Hilliard



 Thomas Sibilly
 Marko Zivkovic
 Malcolm Owen
 Amber Neely



4 Comments
I think this gives a false perception. It isn't actually that iOS users spend more than Android users. It's that there are far fewer of these types of users on Android. The kind of user that actually uses their device the way people use iOS devices is much more rare in the Android ecosystem. The size of the Android market is over inflated by throwaway devices, devices that are only used for specific purposes, cheap work phones, etc. etc. etc.
The reality is that regardless of what "market share" says of iOS vs. Android...."user share" is much more accurately reflected by these kinds of statistics. Easily a 4 to 1 dominance of iPhone users who actually use the thing, vs. Android users who actually user theirs.
Few people who can afford Apple products buy Android. There is at least a perception that Apple is a luxury brand so we're more likely able to afford to spend more.
There is just a lot less Android users who buy top-of-the-line android devices, which cost the same as Apple devices.
In other news, people who buy fake Gucci bags spend less money.
I am an app developer for iOS and Android. Revenue split is 60% Android, 40% iOS. Because my apps are targeted at the European market, where the iOS market share is around 20% - 25%, this is in line with the figures in the article.