Since there’s very little concrete data in the form of research reports, channel checks, and order tracking being that it’s so early on in the quarter, I’ve analyzed Apple’s (AAPL) guidance and the general seasonal and yearly growth trends to form a pretty reliable picture of what investors should expect to see when Apple releases results this October.
The biggest highlight in Apple’s fiscal Q3 earnings report was its uncharacteristically aggressive revenue guidance. The street was generally looking for Apple to provide guidance in the range of $16 to $16.5 billion, and Apple far exceeded those estimates with their incredible $18 billion estimate. Everyone knows Apple’s management to be overly conservatively when providing forward looking statements. So to see an $18 billion estimate come out of Apple was clearly the biggest surprise I’ve witnessed in a long time.
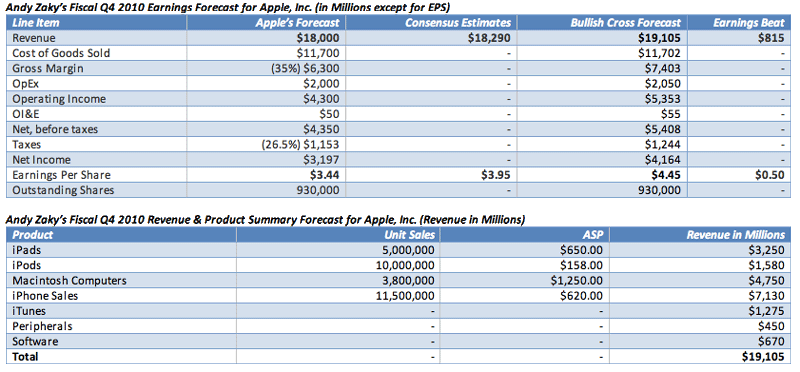
Yet, as many Wall Street analysts have noted in their estimates, there’s reason to breathe caution into the air when relying on Apple’s guidance this quarter. I believe Apple’s management has become slightly more aggressive with its estimates simply because I don’t see where Apple will be able to derive the revenue to far exceed its own expectations this time around. The street is generally modeling for Apple report $3.95 in EPS on $18.29 billion in revenue. While I think the street is a tad bit low in its forecast, I don’t believe Apple will beat estimates by quite as wide of margin as it has in recent quarters. I’m currently modeling for Apple to report $4.45 in EPS on $19.1 billion in revenue.
Philip Elmer-DeWitt at Fortune puts forth a very interesting theory as to what might explain Apple’s seemingly aggressive $18 billion guidance this quarter. He notes, “Wall Street is either betting that apple was hyping its revenue forecast, perhaps to send a message about the death grip flap. Or the analysts, in a time-honored sell-side ploy, were doing some low-balling of their own so clients who follow their advice and buy Apple shares might be pleasantly surprised come the end of the quarter.â€
Both of these theories are quite plausible though I think I buy into the former explanation that Apple was trying to send a message about the negligible financial impact of “antennagate.†Based on Apple’s guidance in conjunction with the seasonal and yearly growth trends, the tables below outline my forecast for Apple’s fiscal Q4. Please be advised that actual results may vary. You can review my track-record on Apple published at Fortune. Philip-Elmer DeWitt keeps an ongoing score of analyst accuracy in his column, Apple 2.0.
For those who care to swim in the minutia, the detailed analysis below forms the basis of my initial estimates. Starting with unit sales and revenue, whenever one draws estimates it’s important to keep Apple’s guidance squarely in mind. If the seasonal and yearly growth trends suggest a revenue number that is far below or beyond the range that Apple tends to beat on its own guidance, then either the estimates aren’t fairly stated or there’s something uncharacteristic about Apple’s guidance.
Most of the time, estimates that fall outside of the normal variance will likely be the result of an error in the methodology rather than a change in Apple’s guidance behavior. Though as I noted above, I think that for this particular quarter, Apple is in fact guiding slightly more aggressive than usual. This much is clear. I’ve drawn up some rather aggressive estimates for Q4 that I think will be pretty difficult for Apple to achieve. And even if Apple meets or slightly exceeds my expectations, it will be a much lower beat than what we’ve seen in the past few quarters. Note: If you don’t want to get too bogged down with detail, stop reading here.
I. UNIT SALES & REVENUE
In the sections below, I lay out the details of my revenue model for Apple’s September quarter. The issue of Apple’s income statement will be taken up in section II of this report.
iPhone Unit Sales & Revenue
It has been somewhat difficult to gauge demand for the iPhone 4 beyond what Apple seems to be telling us with its guidance. Since Apple, as recently as mid-July, has been suffering from iPhone 4 supply constraints, we have very little data in terms of the full potential run-rate for the iPhone. That being said, what we can analyze is the current seasonal and sequential growth trend, and come to a number that is commensurate with Apple’s aggressive revenue guidance.
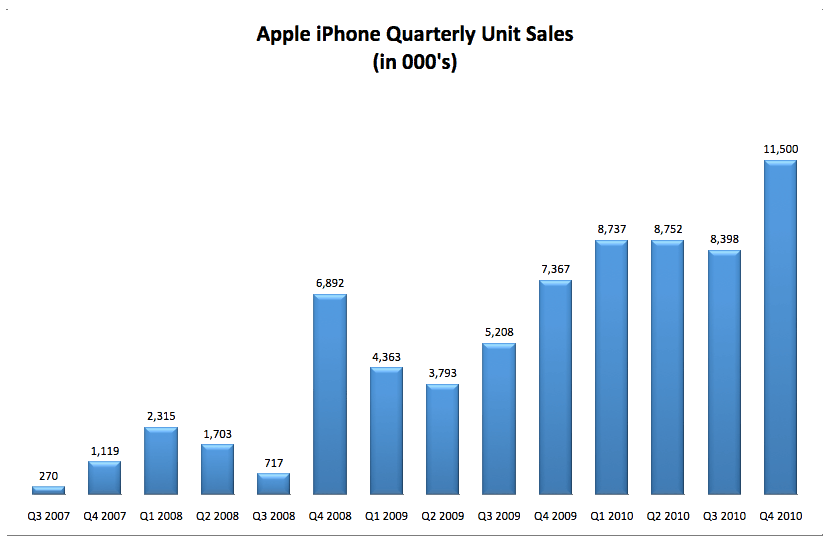
In fact, knowing that it’s much easier to predict Apple’s other product categories, I’ve determined that Apple must sell about 11.5 million iPhones this quarter to meet the implications of its revenue guidance. Analyst estimates seem to range between 10 and 12 million units, but 11.5 seems to be more consistent with Apple’s guidance. Moreover, an 11.5 million iPhone estimate is more or less in harmony with the seasonal, yearly, and sequential growth trends as well.
Starting with the sequential growth trend, last year Apple saw a 41% quarter over quarter increase in iPhone unit sales between fiscal Q3 and Q4. The September quarter tends to see a significant uptick in unit sales due to Apple’s practice of releasing new iterations of the device at the end of June quarter. Based on last year’s sequential growth trend, Apple could sell about 11.8 million iPhones compared to the 8.4 million it sold in Q3.
The current yearly growth trend also seems to support this thesis. For the past few quarters, Apple has enjoyed some rather staggering iPhone growth rates. For Q1, Apple recorded 100.2% unit growth, for Q2 it recorded 131% and for the recently reported Q3, Apple saw 61.3% year over year growth. Thus, an estimate calling for 11.5 million iPhones would suggest a 56% yearly growth rate, which is more or less consistent with the growth rate seen in Apple’s previous three quarters.
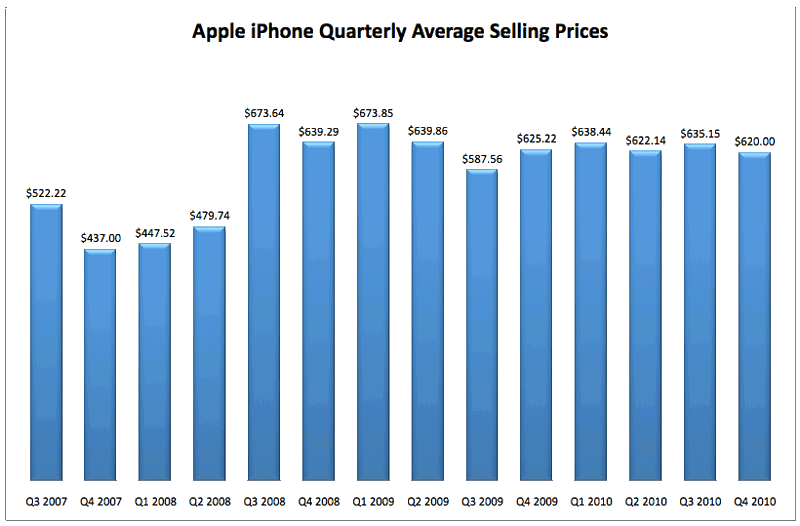
The average selling price of the iPhone and its related products and services is much easier to gauge. The trend has been more or less consistent across the previous four quarters. Apple has generally reported an iPhone ASP range of $620 to $635 over the last several periods. I’m conservatively estimating an ASP of about $620 on the quarter to partly account for the slight hit Apple will take for the free bumper program. Thus, based on sales of 11.5 million units at average selling price of $620, I’m expecting Apple to report about $7.13 billion in iPhone revenue on the quarter. See the charts below.
Macintosh Unit Sales & Revenue
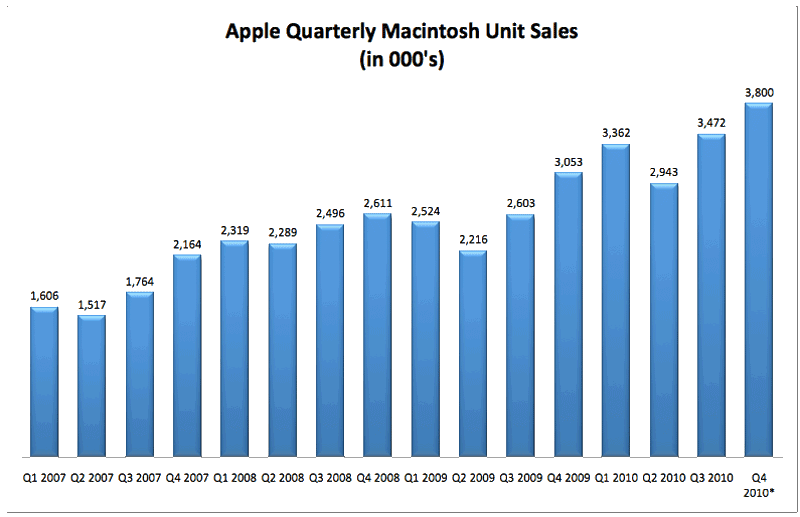
Macintosh unit sales and revenue is significantly easier to predict for the September quarter, and once Gartner data is released, we’ll get a clear idea of what one should expect to see in Q4. Again, the sequential and yearly growth trends both suggest that we should see unit sales fall somewhere in the range of 3.8 to 4.0 million units.
Taking a look at the sequential seasonal growth rate between Q3 and Q4, Apple generally tends to post significant percentage gains largely due to the back to school shopping season. Last year, for example, Apple reported a 17.3% sequential rise between fiscal Q3 and Q4. Yet, in 2008, Apple saw a much lower sequential rise of 4.6% due largely to slower sales as a result of the impact of the financial crisis. However, I think last year’s sequential growth rate provides a more reliable basis for forecast in light of the more stable economic environment. Thus, based on the 17.3% sequential rise between fiscal Q3 and Q4, it is possible that Apple may ship around 4.1 million units this quarter.
Moreover, the current yearly growth rates of Apple’s most recently report three quarters seems to support this view. For Q1 2010, Apple posted Macintosh unit sales growth of 33.2%. For Q2, it reported 32.8% and for Apple’s recently reported fiscal Q3, it recorded sales of 33.4%. Notice how the year over year growth rate has consistently fallen within a range of 32% to 33% for each quarter this year. Thus, if the trend continues and Apple sees a 33.4% year over year rise in Macintosh sales, it’s probable that Apple can post sales of approximately 4.06 million Macintosh computers this quarter.
So while I’m currently modeling for sales of 3.8 million Macs, I believe that once Garter and NPD data is released in October, I will likely be upgrading my assessment of Macintosh unit sales before Apple reports its results. It’s also prudent to be somewhat conservative with initial forecasts in order to leave room to raise estimates in the future.
Using the same methodology to forecast unit sales growth, one can easily predict Macintosh ASP. In fact, it’s even easier to forecast average selling prices than it is to forecast unit sales. When forecasting the September quarter, it’s important to understand that two key issues will likely negatively impact Macintosh average selling prices. First, that Apple offers rather aggressive discount incentives and promotions to students buying a Mac during the back to school shopping season. Secondly, there’s a general shift from sales of Apple’s higher end offerings to lower priced Macs during the quarter. So what we generally witness is a slight decline in ASP between fiscal Q3 and fiscal Q4.
Yet this isn’t always the case. Often times we’ll see Q4 Macintosh ASPs be flat to slightly up on the quarter. The strength of the dollar or Euro weakness also tends to have a big impact on the sequential comparison of Macintosh ASP. In fact, recent weakness in the dollar during the month of July portends a potentially stronger Macintosh ASP than what Apple reported in fiscal Q3. Still, for the sake of conservatism, it’s not a bad idea to model for a slightly lower average selling price than what might be suggested by the weaker dollar. If the dollar continues to weaken throughout the quarter, then I could easily upgrade my assessment of the average selling price.
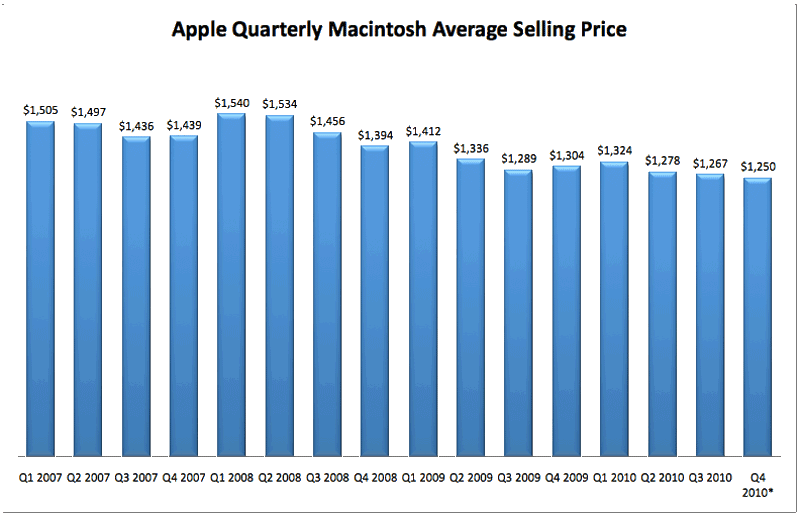
Based on these considerations, I’m modeling for an average selling price of $1,250 on the quarter. That’s just $17 lower than what Apple reported in fiscal Q3. Thus, based on a forecast of 3.8 million unit shipped at a $1,250 ASP, I’m generally looking for Apple report about $4.75 billion in Macintosh revenue this quarter. Yet, as we noted above, it’s possible that once we get all the relevant data, a forecast of over $5 billion in Macintosh revenue might be more appropriate. The two charts below outline Macintosh unit sales and average selling prices from 2006 to the present.
iPod Unit Sales & Revenue
iPod unit sales were very disappointing in Q3, and it makes it difficult to gauge how well they will sell in Q4. Yet, I did note in two different articles that iPod sales as a percentage of Apple’s total revenue has been on a consistent decline since 2006. That the market doesn’t give much of a crap about how iPod unit sales fare anymore (this was proven true by the mere fact that the market brushed aside the huge miss in unit sales during Q3), and that Apple’s reliance on the device as a driver of revenue isn’t as important as it once was in the past. See here and here.
In fact, revenue from the device formed only a tiny portion of Apple’s total revenue in Q3 as it only accounted for merely 9.8% of the business. Moreover, iPod fell to the fourth largest contributor of Apple’s overall revenue for the first time in the device’s history in Q3. In its inaugural quarter, even iPad revenue far surpassed iPod revenue in Q3, and iTunes revenue seems to be closing in to push iPod unit sales to fifth place.
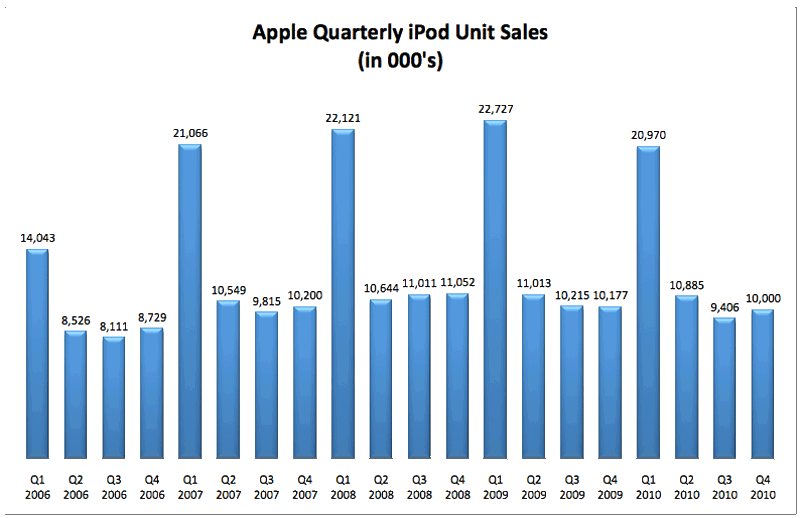
Yet, this debate aside, I’m modeling for sales to come in at 10 million units in Q4 as the September iPod refresh looks to revitalized sales on the quarter. It’s not uncommon to see unusually weak iPod unit sales in Q3 from time to time. In fact, Apple reported a similar plunge in unit sales between Q2 and Q3 of 2007 and 2009. Yet, sales did in fact rebound quite significantly in Q4 once Apple released its new lineup of iPods during the last month of the quarter. Thus, we’ll have to wait for NPD data to get a rough idea of what we can expect to see on the quarter.
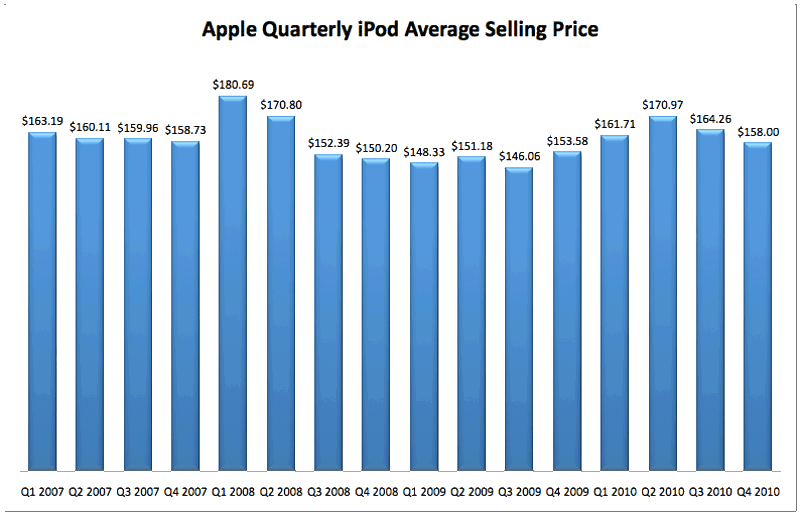
iPod average selling prices are a much easier variable to forecast. I expect iPod ASP to come in at $158 based on the current seasonal and sequential trend. Thus, based on sales of 10 million iPods at an average selling price of $158, I’m expecting to see roughly $1.58 billion in iPod revenue - just a fraction of what Apple will likely report in iPad, iPhone and Macintosh revenue this quarter. The two charts display iPod unit sales growth and average selling prices over the past several years.
iPad Unit Sales & Revenue
I expect iPad sales to pick up quite a bit over the 3.3 million units Apple reported in Q3. As Apple works to meet the current supply-demand imbalance over the next month or so, we’ll probably see a strong run rate in the second half of the quarter. Also, Apple’s newest products tend to do a lot better in terms of sales after their inaugural quarters. Add the benefit of the back to school shopping season and we should expect to see sales come in at around 4.5 to 5 million units. We have very little data in terms of the seasonality for the iPad, but the fourth quarter is generally a strong quarter for Apple indicating that we should see a strong uptick in sales. Thus, based on $650 ASP, I’m looking for Apple to post about $3.25 billion in iPad revenue this quarter.
iTunes Revenue
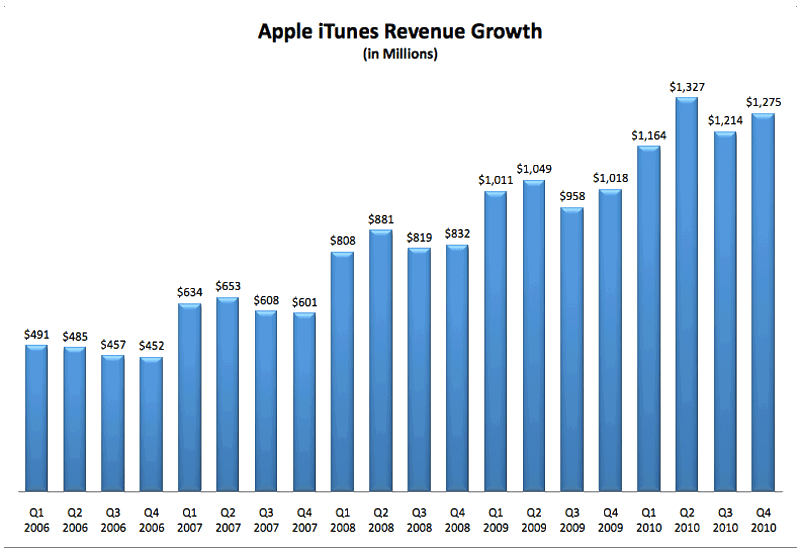
iTunes revenue continues to consistently grow over the quarters making it relatively easy to forecast. Usually, iTunes revenue tends to be flat sequentially between Q3 and Q4 yet I think Apple will benefit from higher activity from strong sales of the iPad on iPhone 4. I’m modeling for a slightly higher sequential rise in iTunes revenue than what Apple has seen in the past. Moreover, though iTunes revenue growth has tended to be flat from Q3 to Q4 in the past, in 2009 we did see quite a bump in revenue despite the prior trend. Thus, I’m expecting iTunes revenue to come in at $1.275 billion or slightly above the $1.214 billion apple reported in Q3. See the chart below.
Peripherals Revenue
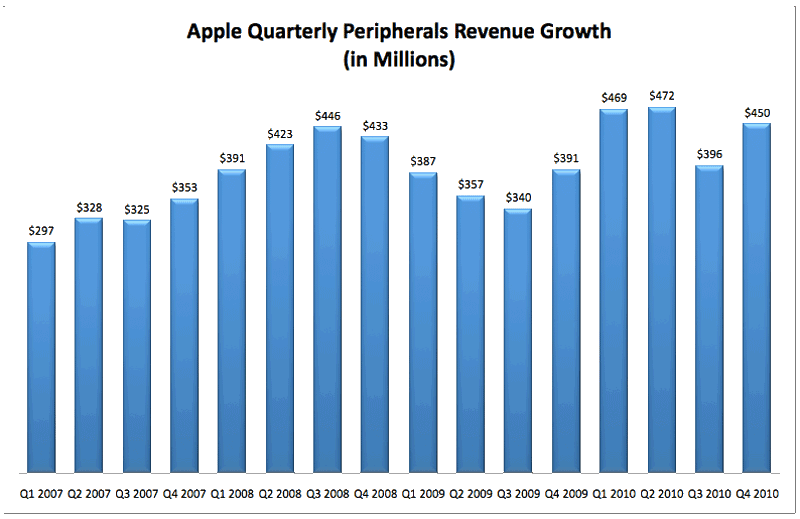
In terms of peripherals revenue, what we tend to see over the past two years is a steep decline in peripherals during Q3 followed by a steep rebound in the September quarter. I’m basically looking for that same seasonal trend to continue, and I’m modeling for revenue to jump to $450 million this quarter. That compares to the $396 million Apple reported in Q3.
Software Revenue
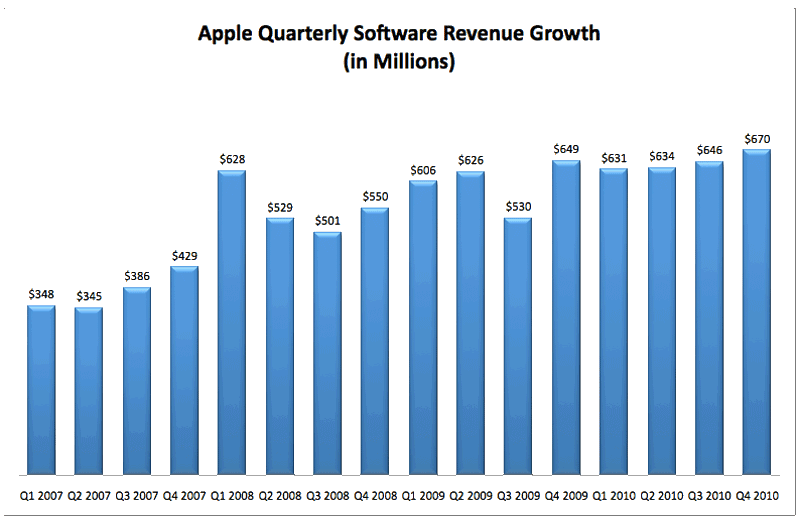
Software revenue is slightly easier to forecast than peripherals. What we get is nice consistent software revenue growth and a peaking in fiscal Q4. With the exception of the occasional operating system release, Apple’s Q4 software revenue has tended to slightly outperform the previous three quarters. See the chart below. Thus, based on the trend in software revenue, I’m modeling for Apple to report $670 million in fiscal Q4 versus the $646 it reported in Q3.
II. THE INCOME STATEMENT
Now that I’ve laid out the details of how I arrive at my $19.1 billion revenue estimate for Apple’s September quarter, the sections below will go through and discuss line items in my income statement model to arrive at $4.45 in EPS.
Revenue, Gross Margin & the Cost of Goods Sold
Gross margin is the amount of money Apple makes on each of its products less the cost it takes to make those products. The only costs considered are the manufacturing cost, the bill of materials, and the packaging cost. These costs are called the cost of goods sold or ‘COGS.’ Subtracting the total cost of goods sold from Apple’s overall revenue will give you Apple’s gross margin.
Determining what Apple’s total gross margin will be in any one of Apple’s fiscal quarters requires an understanding of which of Apple’s product tend to carry higher gross margins, a careful analysis of Apple’s guidance for gross margin, the seasonal trend, the strength of the U.S. Dollar relative to the Euro, and whether a newly introduced product carries a higher or lower gross margin relative to the company’s average.
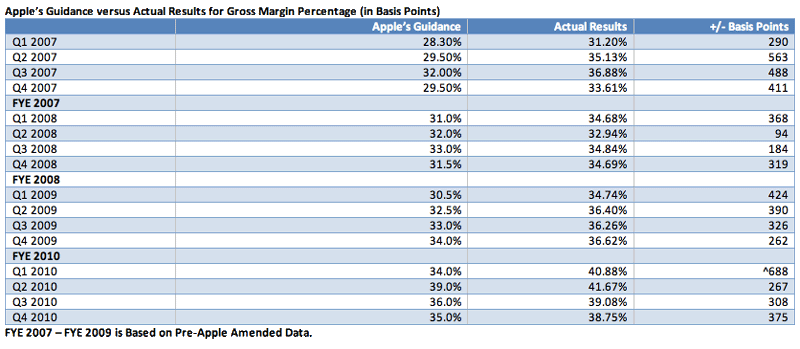
Apple’s management has repeatedly noted that the iPad tends to carry a lower gross margin due to the company’s strategy to aggressively price the product in a way that is very competitive relative to the industry. Based on this and other considerations, Apple guided gross margins down to 35% from the 39% it reported in fiscal Q3. Yet, it’s important to note that Apple tends to be overly conservative with its gross margin guidance. In fact, Apple beat its gross margin guidance by over 300 basis points last quarter.
The table below compares Apple’s gross margin guidance to its actual results. Please keep in mind that in order to get an accurate reading of Apple’s guidance behavior, it’s important to refer to Apple’s pre-amended quarterly results. Starting in Q1 2010, Apple changed its GAAP revenue accounting system for the iPhone and has thus amended every quarterly report since fiscal Q3 2007 to reflect this change. Yet, there’s no point in comparing Apple’s guidance to amended results because in order to analyze Apple’s guidance behavior, one has to compare their guidance to the original results for which their guidance was originally intended. Any time I analyze Apple’s guidance behavior, I’ll be referring to pre-amended results for any quarter that was eventually amended. Obviously this doesn’t apply to fiscal Q2 – Q4 of 2010.
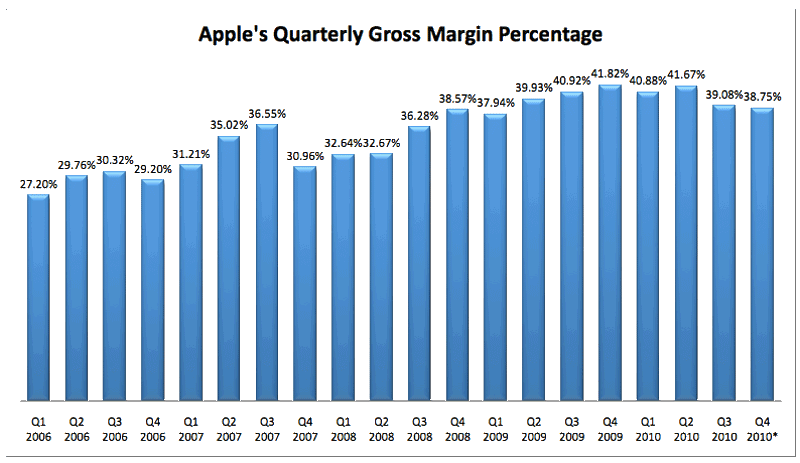
Moreover, for the past two years, Apple’s September quarter has tended to outperform its fiscal Q3 on the gross margin front. This is largely due to the sizable uptick in iPhone sales which tends to carry a larger overall gross margin than Apple’s other products. Yet, at the same time, with an expected rise in iPad sales on the quarter, I’m expecting to see a slight decline in overall gross margin sequentially. Even Apple’s gross margin guidance for Q4 was 100 basis points less than its gross margin guidance for fiscal Q3. Thus, based on all of this data, I’m modeling gross margin percentage to come in at around 38.75% versus the 39.08% Apple reported in fiscal Q3. Thus, I’m looking for Apple to report about $19.105 billion in revenue, 11.702 billion in the cost of goods sold and $7.403 billion in gross margin.
Operating Expenses & Operating Income
Operating expenses include those expenses related to running the Apple operation. The geniuses at the Apple store, Steve Jobs’ $1 income, the rental cost of all of Apple’s retail stores, the employees, the paperwork, the Apple campus in Cupertino and all other money spent to run the company are operating expenses. Based on the current trend in Apple’s guidance, one can produce a pretty reliable picture of what Apple will probably report in the September quarter.
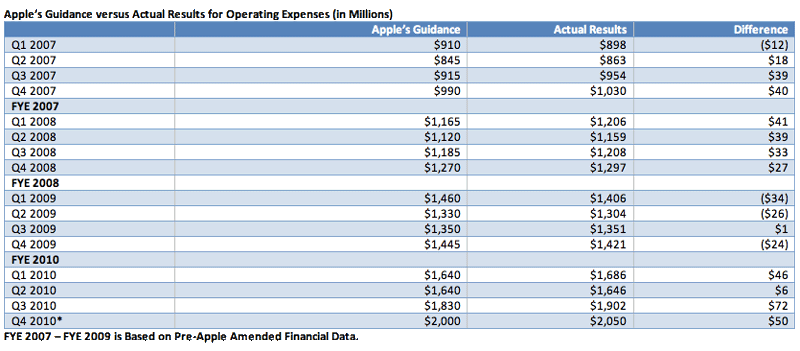
There were several quarters where I was able to forecast these expenses almost perfectly because Apple would regularly guide $40 million under the actual results. Picking up on this trend, it has been relatively easy to predict these expenses. Yet, one must also consider the growth trend of these expenses to help facilitate a strong forecast. The chart below compares Apple’s guidance for operating expense to actual results.
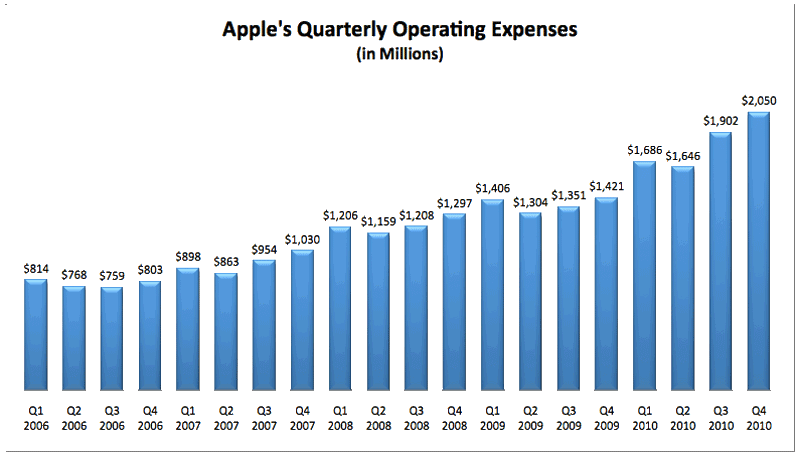
For Q4, I’m modeling for an estimate of $2.050 billion in operating expenses based on Apple’s guidance, and based on the trend. Knowing that Q4 tends to be one of the highest quarters in terms of operating expenses due to Apple mass hiring to meet consumer demand of the iPhone and back to school shopping season, I’m expecting a $150 million bump to $2 billion in Q4. The chart below outlines Apple’s operating expenses from 2006 to 2010.
To arrive at operating income, income that Apple generates from its primary operations, one must simply subtract operating expenses from gross margin. Remember operating expenses are those expenses that only include the costs to run the entire Apple operation. Gross margin, on the other hand, is the amount of money Apple makes on the sale of each of its goods (revenue) minus the cost it takes to bring those goods into existence i.e. to make those goods. Thus, for Q4 I’m forecasting an operating income of $5.353 billion, which is the difference of subtracting $2.050 billion in operating expenses from $7.403 billion in projected gross margin.
Other Income & Expenditures
Companies will regularly make and/or lose money on the sale of property, from interest on their cash deposits, or from investments. Good accounting requires that we keep that income or loss in a separate category because it would be inappropriate to suggest that income from an investment should be part of the income that Apple receives from the sale of its goods.
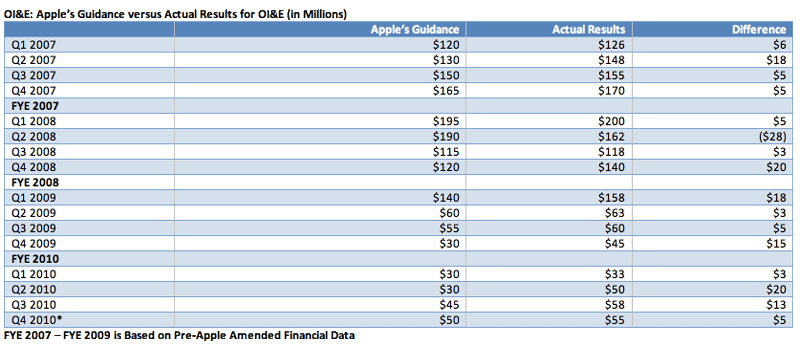
So under generally accepted accounting principles (GAAP) we have a line item in the income statement called “Other Income & Expenses†or OI&E. Though the dollar amount of OI&E is generally a small amount compared to Apple’s operating income, it can and will regularly affect EPS and so it should be taken seriously. Based on Apple’s guidance, which generally undercuts or overstates OI&E by about $5 - 10 million, I’m projecting OI&E to come in at about $55 million for Q4. The table below compares Apple’s OI&E guidance to actual results for the past several years.
Net Income, before appropriations for income taxes
Finally, to arrive at income before a provision for income taxes, one only needs to add operating income to OI&E. In this case, I’m expecting $5.922 billion in operating income, and $35 million in OI&E for Q4. Thus, we arrive at a net income before taxes of $5.957 billion.
The Tax Rate
Last quarter many of my readers were quick to criticize my tax rate estimate despite my long history and track record following Apple. I had a tax rate guidance of 23.6%, which while slightly lower than the reported 24.2% tax rate, was far more in-line than the 27% suggested by many of those criticizing my aggressive tax forecast. Some of my readers even harped on Apple’s comments that fiscal Q2’s low tax rate was just a one-time thing, and that it was nuts to model for an aggressively low tax rate for Apple fiscal Q3 and Q4 in my analysis.
Well if there’s one thing I learned from following Apple’s guidance over the years, it’s that rarely is any benefit just a one-time thing and that’s Apple’s fiscal Q4 tax rate is generally lower than that of Q3. That’s why I had a low tax rate in my initial Q4 estimates when I published them about a month ago. And as I expected, Apple’s tax rate guidance for Q4 is the lowest in the company’s history! In the future, I would appreciate it if my readers would just trust me so I don’t have to write a dissertation explaining my methodology every time I draw up estimates for Apple. In fact, this will be the last time I go into such detail. In the future I’ll just publish the estimates and refer to this article for the methodology.
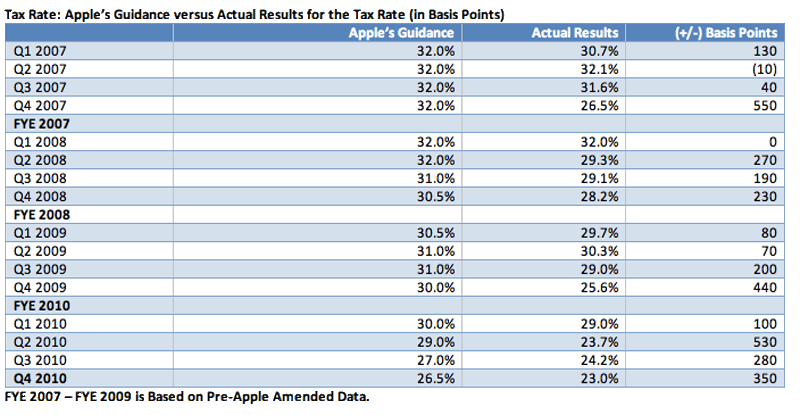
The table below compares Apple’s guidance to their actual results over the past several years. Notice how Apple generally guides way above what it tends to report in taxes. Based on the trend in Apple’s tax guidance, I’m modeling for a 23% tax rate on the quarter.
Net Income
Thus, based on a tax rate of 23.0% for Q4, I’m looking for Apple to record a post tax profit of $4.164 billion in fiscal Q4. Apple will also probably generate more or less that amount in cash.
Earnings per Share
Once you arrive at net income, the job is basically done. One only needs to divide net income by the number of projected outstanding diluted shares to arrive at Earnings Per Share or EPS. Based on a projection of 930 million shares outstanding at the end of Q4 2010, my estimates are calling for Apple to report $4.45 in EPS on $19.105 billion in revenue versus the current consensus of $3.95 in EPS on a conservative $18.29 billion in revenue.
Andy Zaky is a graduate from the UCLA School of Law, an AppleInsider contributor and the founder and author of Bullish Cross — an online publication that provides in-depth analysis of Apple's financial health.
 Andy M. Zaky, Bullish Cross, Special to AppleInsider


-m.jpg)






 Charles Martin
 Christine McKee
 Wesley Hilliard
 Malcolm Owen
 Andrew Orr
 William Gallagher
 Sponsored Content





16 Comments
This is very nicely done, and you put in lots of work. Much appreciated.
However, much as seasonality effects are important, your data, charts, and insights would be far more digestible if were largely annual, except for the 3Q comparisons and forecasts noted as needed. Currently, it is eyeful to digest, that's all.
Add: You could provide a link to the more detailed analysis, and people will look it up if they want all the wonderful detail.
Then Mr. Zaky would have not titled his original presentation,* "An In-Depth Look at Apple's September Quarter," would he?
*http://bullcross.blogspot.com/
wayyy too much time on your hands, andy. Leave it to the pros.
wayyy too much time on your hands, andy. Leave it to the pros.
He is a pro!
Very impressive analysis. Thanks for the time and effort!