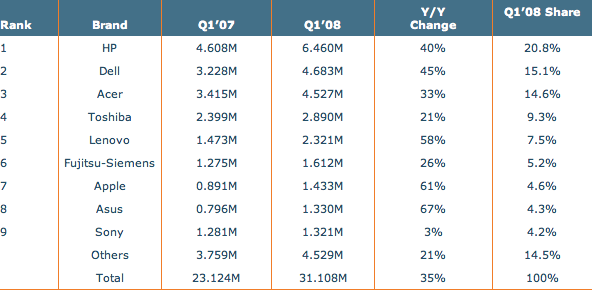
Data released this week by DisplaySearch ranked Apple 7th amongst the world's largest notebook manufacturers, up from the 8th position it's held since the first quarter of 2007. The firm now estimates the company's global share at 4.6 percent, thanks to sales of more than 1.43 million portable systems during the three-month period ending March, an increase of 61 percent year-over-year.
Apple wasn't the only notebook maker who managed to buck the historic trend that has seen unit volumes decline quarter-to-quarter from the fourth calendar quarter to the first, noted John Jacobs, Director of Notebook Market Research at DisplaySearch.
"Dell, perhaps as a result of an increased focus on retail and Greater China, as well as Toshiba, avoided this trend," he said. "Also of particular note were Apple’s 7 percent and Samsung’s 15 percent [quarterly] growth. Apple’s entry-level notebook starts at more than $1,000, while Samsung, at present, only sells notebooks in Asia-Pacific, Europe, the Middle East and Africa, and greater China."
Overall, HP remained No. 1 in the notebook PC market for the seventh consecutive quarter, maintaining a lead of almost 2 million units over Dell. But Acer, which recently acquired Gateway and Packard Bell, is fast approaching the No. 2 slot, having sold just 156,000 units less than Dell in the first quarter.
Meanwhile, DisplaySearch said the most popular panel size and resolution continues to be 15.4" 1280 × 800, which accounted for almost 50 percent of all notebook PCs shipped in the quarter. In a distant second position was 14.1" 1280 × 800 with 22 percent share, though in China and the Asia Pacific countries, 14.1†notebook PCs had twice as much share.
Looking further into 2008, the research firm said it expects notebook PC shipments to continue to grow, with total units likely exceeding 135 million units for the year.
 Katie Marsal

-m.jpg)






 Malcolm Owen
 Christine McKee

 Charles Martin


 William Gallagher
 Amber Neely







23 Comments
Asus may push Apple back to 8th it it can't get ahead of Fujitusu next year. Those Eee PCs are cheap and popular.
The worldwide market for notebook computers shrank 6 percent during the first quarter of 2008,
Am I mistaken, or does the table state that the companies in that list sold 35% more than the previous year?
Am I mistaken, or does the table state that the companies in that list sold 35% more than the previous year?
Yeah, that is what I thought at first. I think, however, the 6% shrinkage was between Q4 '07 and Q1 '08 (for which there was no chart). On the other hand, the year to year result shows significant growth, if that chart is correct.
Am I mistaken, or does the table state that the companies in that list sold 35% more than the previous year?
Yeah, I don't get it either.
Confusing info on AI, how completely unfamiliar.